Download
1 / 20
200 likes | 207 Views
Tropical Cyclone QPF. David Roth NOAA Hydrometeorological Prediction Center Camp Springs, MD. March 22, 2006. Rainfall forecasts from landfalling TC’s. standard forecasting tools. Local Tropical Cyclone Rainfall Climatology GFS/NAM/GFDL precipitation forecasts

E N D
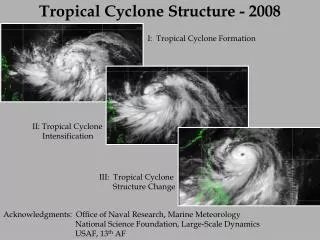
Tropical Cyclone QPF David Roth NOAA Hydrometeorological Prediction Center Camp Springs, MD March 22, 2006
Rainfall forecasts from landfalling TC’s standard forecasting tools • Local Tropical Cyclone Rainfall Climatology • GFS/NAM/GFDL precipitation forecasts • r-CLIPER (Climatology based on 1st order stations) • TRaP (persistence to capture structure/Day 1) standard validation tools • bias score • equitable threat score
Factors impacting rainfall distributions in landfalling TC’s • Storm track • Storm size • Topography • Nearby synoptic-scale features • Time of day – core rainfall overnight/ outer band rainfall during daylight
Percent of Maximum storm total rainfall (Hrs)81 cases – 1991-2005 Average Maximum 0.92 1.40 1.76 2.04 2.98 3.61 5.01 6.71 9.77 11.48 12.34 13.34 1.90 3.04 4.56 6.08 10.04 13.47 22.27 28.33 32.52 35.29 36.31 40.68
Picking an analog for a TC event • Size is important…look at the current rain shield and compare it to storm totals from the past • Is/was there vertical wind shear in current and past events? • Look for storms with similar/parallel tracks • Is topography/prism data a consideration? • Look for fronts in the vicinity for current and possible analogs • Not all TC events will have a useful analog
Production of TC QPF • Forecasts made in six-hourly increments from Hour 12-84 • and in one 48 hour chunk for Hours 84-132 twice a day by • 3 forecasters (Day 1, Day 2/3, and Medium Range temps/pops) • Start With Model Closest to TPC Forecast (usually GFS) • Locate relevant synoptic scale boundaries/coastal front • Use conceptual models/current structure to modify/shift QPF • (TRaP and recent satellite/radar imagery for current structure) • Look at storm-relative shear/H2 winds to further shift/limit QPF • Use climatology (PRISM, r-CLIPER, TC Rainfall Climatology) to: • Temper down forecast bias/act as a reality check • Depict areas of terrain that could be significantly impacted • Help Create TC rainfall statements for the Public Advisories • Forecasts issued at by 06/18z (Days 1-3) and 12z/0z (Days 4-5 and • 5-day accumulation graphic)
QPF Equitable Threat Score Where H = “Hit” area F = Forecast rain area O = Observed rain area H -chance ETS = F + O – H -chance No overlap: Hit area = 0 Fcst Obs ETS ~ 0 Hit Area Hit area = ½ Forecast area ETS ~ 0.33 Hit area = Forecast area ETS = 1.0
TC Model Track Error (km) (2003-2005) GFDL: 71.5 110.8 145.9 183.7 276.2 383.5 512.5 GFS: 78.1 117.6 155.6 202.1 289.5 460.5 580.2 UKMET: 89.3 137.3 180.1 220.7 295.2 463.0 556.8 NAM: 96.7 167.0 236.4 302.3 410.9
Maximum Potential Equitable Threat Score improvements due to shifting grid
Dependence on TPC track - Rita Threat/Bias for 5 Day QPF September 21/12z Forecast 0.25 .453 1.52 H G .498 1.39 0.50 .350 1.46 H G .414 1.35 1.00 .197 .961 H G .258 1.24 2.00 .030 .725 H G .168 .858 3.00 .013 1.28 H G .093 1.06 4.00 .009 2.61 H G .069 1.86 5.00 .000 3.49 H G .021 3.01 6.00 .000 4.23 H G .018 4.69 September 22/12z Forecast 0.25 .536 1.33 H G .541 1.08 0.50 .468 1.18 H G .534 .978 1.00 .367 1.07 H G .366 .781 2.00 .164 .777 H G .234 .792 3.00 .163 1.35 H G .224 .916 4.00 .128 2.50 H G .199 1.63 5.00 .090 3.74 H G .174 2.18 6.00 .090 5.71 H G .161 2.98
Pattern comparisons for U.S. landfalling stormsFrom Rogers, Black, Marchok, 2005 IHC Equitable Threat Score
QPF Skill – Core Rainfall (1998-2004)From Rogers, Black, Marchok, 2005 IHC 0-100 km
Summary comparison for all modelsFrom Rogers, Black, Marchok, 2005 IHC Pattern • GFS performs best • all models show skill relative to R-CLIPER • GFDL worst among numerical models Volume • All models essentially equivalent • GFS slightly better • all show skill over R-CLIPER
Summary comparison for all models (cont.) Extremes • GFS best • GFDL produces too much of heaviest rain • both show skill over R-CLIPER • Eta shows no skill over R-CLIPER Sensitivity to track error • GFS least sensitive to track error • GFDL, Eta more sensitive to track error than R-CLIPER
Cindy, Dennis, Katrina, Ophelia, Rita, & Wilma – Threat Scores
Coming Attractions • Growing TC rainfall climatology online; to additional mesonet rainfall information being included (i.e. Chester County PA, MA) • New r-CLIPER to account for topography and shear for 2006 • Operational model improvements (ECMWF 1/06, GFS/NAM upgrades continue) • New Models (WRF)