Download
1 / 32
320 likes | 440 Views
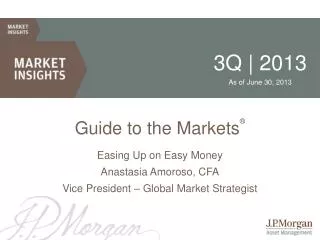
3Q2012 for the period ended 9/30/2012. ING Global Perspectives Markets. Insights. Opportunities. Presented by: Douglas Coté, CFA Chief Market Strategist ING Investment Management U.S. All of the data contained herein is as of 9/30/2012. ING Global Perspectives

E N D
3Q2012 for the period ended 9/30/2012 INGGlobal Perspectives Markets. Insights. Opportunities. Presented by: Douglas Coté, CFA Chief Market Strategist ING Investment Management U.S.
All of the data contained herein is as of 9/30/2012 INGGlobal Perspectives Markets. Insights. Opportunities. Disclosure This presentation has been prepared by ING Investment Management for informational purposes. Nothing contained herein should be construed as (i) an offer to sell or solicitation of an offer to buy any security or (ii) a recommendation as to the advisability of investing in, purchasing or selling any security. Any opinions expressed herein reflect our judgment and are subject to change. Certain of the statements contained herein are statements of future expectations and other forward-looking statements that are based on management’s current views and assumptions and involve known and unknown risks and uncertainties that could cause actual results, performance or events to differ materially from those expressed or implied in such statements. Actual results, performance or events may differ materially from those in such statements due to, without limitation, (1) general economic conditions, (2) performance of financial markets, (3) interest rate levels, (4) increasing levels of loan defaults (5) changes in laws and regulations and (6) changes in the policies of governments and/or regulatory authorities. The opinions, views and information expressed in this commentary regarding holdings are subject to change without notice. The information provided regarding holdings is not a recommendation to buy or sell any security. Past performance is no guarantee of future results.
INGGlobal Perspectives Markets. Insights. Opportunities. The Folly of Gaming Diversification Global Perspectives on the Markets Tectonic Shifts Impacting Global Growth = Global Perspectives Monthly Book page number
INGGlobal Perspectives Markets. Insights. Opportunities. The Folly of Gaming Diversification
Implementing an Effective Diversified Strategy • Folly of Gaming Diversification • Investors try to outsmart markets • Investors abandon diversified positions to sidestep impending risks or crowd into area of strong returns • Reactionary in nature and directionally wrong • Effective Diversification • Global broad asset class expands opportunity • Intelligent risk taking with a focus on compensated risks • Adding high return assets to increase return and potentially decrease risk Source: ING Investment Management
Capital Market Returns 81 • Capital market returns vary widely over time, making asset allocation decisions difficult and successful market timing virtually impossible. Note: For illustration only. Past performance is not a guarantee of future results. Investors cannot invest directly in an index. Source: FactSet, ING Investment Management. Retirement
Global Perspectives Model Allocation 5 • Returns for a globally diversified strategy over the last 10 years refute the notion of a “lost decade”. No Lost Decade The Global Perspectives Model includes 10 asset classes, equally weighted: S&P500, S&P400 Midcap, S&P600 Smallcap, MSCI U.S. REIT Index, FTSE NA REIT Index, MSCI EAFE Index, MSCI BRIC Index, Barclays Capital (BC) U.S. Corporate Bonds, BC U.S. Treasury Bonds, BC Global Aggregate Bonds, BC U.S. High Yield Bonds. Returns are annualized for periods longer than 1 year. Source: FactSet, FTSE NAREIT, ING U.S. Investment Management. Overview
INGGlobal Perspectives Markets. Insights. Opportunities. Global Perspectives on the Market
Global Perspectives on the Markets • Fundamentals: primary driver of markets • Advancing Corporate Profits • Broadening Manufacturing • Consumer Strength Underestimated • Developing Economies Drive Global Growth • Global Risks: secondary driver unless a breach occurs • European Debt Crisis • U.S. Debt and Growth Crisis • China Hard Landing • Commodities Bubble 8 Overview
Advancing Corporate Earnings 15 • Since 1999 the market’s price return is negative, but earnings have grown 250% — from $39 to $97 in 2011 — and are on track to reach $105 by the end of 2012. $105 per share forecasted Source: Factset, ING Investment Management
Advancing Corporate Earnings 14 • Accelerating and positive earnings drive markets up, and decelerating and negative earnings drive markets down, albeit with a reporting lag. 2012 S&P 500 Earnings Forecast: $105 2012 S&P 500 Price Forecast: 1425 Source: Standard & Poor’s, First Call, FactSet, ING Investment Management 10
Broadening Manufacturing 52 • U.S. factory activity slipped into contraction territory based on economic uncertainties in the euro zone and China and fears of the effects of the “fiscal cliff” here at home. Global Manufacturing U.S. Institute for Supply Management Expansionary (>50) Non Manufacturing 551 48.4 51.5 44.0 Manufacturing Contractionary (<50) Source: Institute of Supply Management, Federal Reserve, FactSet Economy
Consumer Strength Underestimated 48 • Retail sales, personal consumption and personal incomes are at all time highs despite high unemployment. The consumer makes up 70% of the U.S. economy. $ billions $ billions Consumer Trends Consumer Trends Personal Income Personal Consumption Expenditures Retail Sales Source: FactSet
S&P Case-Shiller Home Price Index 58 • Home values are still 31% below 2006 levels but the 20 City Composite Index has shown recent upticks and signs of a sustainable recovery with the first year over year price increase in two years. Index Level % 1 YR change 207 142 Source: Factset, S&P Case-Shiller, Bloomberg 13 Economy
Unemployment Rate 55 • High unemployment may reluctantly recover as growth resumes; recent reports are somewhat mixed. 000’s Recessions Unemployment Rate Initial Unemployment Claims Source: Bureau of Labor Statistics, FactSet Economy
Developing Economies - World GDP and Emerging Market Importance 43 • Despite the great recession, world GDP continued to rise due to growth in emerging markets. World GDP Source: The World Bank Group * China, India, Russia, Brazil, Mexico, Korea, Indonesia and Taiwan 15
Developing Economies — Shanghai, China 1990 (Catherine Rampell photo)
Developing Economies — Shanghai, China, 2010 (Catherine Rampell photo)
Global Risks — European Debt Crisis 45 • PIIGS countries’ debt as a % of GDP is unsustainable. Source: International Monetary Fund (IMF) as of 2011 18
Global Risks — U.S. Debt 61 • The total federal public debt outstanding exceeds 95% of GDP (excluding Social Security and Medicare), a level that triggered the U.S. downgrade by S&P. The current U.S. deficit is over $1.4 trillion — more than 9% of GDP. % of GDP U.S. Government Debt Deficit Levels $ > 95% of GDP Debt > 9.4% of GDP Debt Deficit Deficit Source: Factset 19
Breakdown Consumption: 71% Government: 20% Investment: 12% Exports: 12% Imports: (15%) Global Risks — U.S. Growth 56 • The economy has surged after each of the past 2%+ falls in GDP (Y/Y) since 1948. The U.S. has recovered the output level it lost in the recession and has now reached new highs. Expansions historically last about five years. Source: Bloomberg 20
Global Risks — China Hard Landing • China’s declining industrial and electricity production as well as stalled export growth raises fears about the likelihood of a “hard landing” from its enviable recent growth. China GDP growth is now reported to be 7.9%. Y/Y % change Export Growth Electricity Production Industrial Production Source: Factset 21 International
Tectonic Shifts — Trade 67 • New trade routes between Asian and Latin American countries — the intra-emerging market trade — are re-shaping the economic landscape U.S. Trade $USD billions $USD billions Recessions Trade Deficit (left axis) Highest Export Level - JUN $185 Bil Imports (right axis) Exports (right axis) Source: FactSet
Tectonic Shifts — Technology Technological innovation is unpredictable and unstoppable, exerting a powerful influence over every sector of the market
Tectonic Shift — Energy 64 • The abundance of natural gas in North America, as well as the ability to extract oil from shale, is changing the global energy landscape. Horn River nShale Gas Basins nDevonian/Mississippian Shale Fairway Structural Deformation of Crust Montney Colorado Group Laramide Thrust Belt Utica Gammon Horton Bluff Bakken Appalachian Thrust Belt Mowry Utica Antrim Green River Baxter Mobrara New Albany Marcellus Mancos McClure Cane Creek Excello/Mulkey Sources of Energy in U.S. Manufacturing Natural Gas: 27% Electricity: 13% Liquefied Petroleum: 11% Coal: 8% Fuel Oil: 2% Other : 39% Ohio Pierre Gothic Woodford Hovenweep Fayetteville Monterey Palo Duro Lewis Chattanooga Mancos Barnett/ Woodford Floyd/ Conasauga/ Neal Haynesville Bossier Barnett Ouachita Thrust Belt Laramide Eagle Ford Thrust Belt Note: Oil Prices are West Texas Intermediate light crude spot price (NYMEX). Source: Advanced Resources, SPE/Holditch Nov 2002 Hill 1999, Cain, 1994 Hart Publishing, 2008 modified from Ziff Energy Group Source: U.S. Dept of Energy, FactSet Source: Census Bureau, http://upload.wikimedia.org/wikipedia/commons/b/b4/Plate_tectonics_map.gif Economy
Global Perspectives on 2012 This forecast of future expectations is based on managements' current views and involves known and unknown risks and uncertainties that could cause actual results, performance or events to differ materially from those expressed or implied.
Executive Summary The Folly of Gaming Diversification Global Perspectives on the Markets Tectonic Shifts Impacting Global Growth
INGGlobal Perspectives Markets. Insights. Opportunities. Thank You www.INGglobalperspectives.com
Index Definitions Barclays Capital U.S. Aggregate Bond Index is composed of U.S. securities in Treasury, Government-Related, Corporate, and Securitized sectors that are of investment-grade quality or better, have at least one year to maturity, and have an outstanding par value of at least $250 million. Barclays Capital U.S. Corporate High-Yield Bond Index tracks the performance of non-investment grade U.S. dollar-denominated, fixed rate, taxable corporate bonds including those for which the middle rating of Moody’s, Fitch, and S&P is Ba1/BB+/BB+ or below, and excluding Emerging Markets debt. Barclays Capital Global Aggregate Bond Index measures a wide spectrum of global government, government-related, agencies, corporate and securitized fixed-income investments, all with maturities greater than one year. The Credit Suisse/Tremont Hedge Fund Index is an asset-weighted hedge fund index covering over 5000 funds with at least US$50 million under management, a 12-month track record, and audited financial statements. It is calculated net of performance fees and expenses. CS/Tremont sub-indexes track hedge fund strategies according to the methods by which fund managers seek investment opportunities such as by asset class and/or use of leverage. Dow Jones Industrial Average is a price-weighted average computed from the stock prices of 30 large, widely held public companies in the U.S., adjusted to reflect stock splits and dividends. FTSE NAREIT US Real Estate Index presents comprehensive REIT performance across the U.S. economy, including all commercial investment and property sectors. FTSE EPRA/NAREIT Global Real Estate Index is designed to represent general trends in eligible real estate equities worldwide. The Chicago Board Options Exchange Volatility Index (CBOE VIX) is a measure of the implied volatility of S&P 500 index options. It is one measure of the market's expectation of volatility over the next 30 day period. JPMorgan Emerging Markets Bond Index Plus (EMBI+) tracks total returns for actively traded emerging markets debt instruments including U.S.-dollar denominated Brady bonds, Eurobonds, and traded loans issued by sovereign entities. MSCI EAFE Index is a free float-adjusted market capitalization weighted index designed to measure the developed markets’ equity performance, excluding the U.S. & Canada, for 21 countries. MSCI Europe Index is a free float-adjusted market capitalization weighted index designed to measure equity performance of the developed markets in Europe consisting of 16 country indices. MSCI Pacific Index is a free float-adjusted market capitalization weighted index designed to measure developed markets’ equity performance of the in the Pacific region consisting of 5 countries. MSCI Emerging Markets Index is a free float-adjusted market capitalization index that measures emerging market equity performance of 22 countries. The Municipal Bond Index is a bond index that includes investment-grade, tax-exempt, and fixed-rate bonds with long-term maturities (greater than two years) selected from issues larger than $50 million. NASDAQ Composite Index is a market capitalization weighted index of the performance of domestic and international common stocks listed on The NASDAQ Stock Market including over 2,800 securities.
Index Definitions The NCREIF (National Council of Real Estate Investment Fiduciaries) Property Index (NPI) is a market value-weighted index of total rates of return for a large pool of commercial real estate properties acquired in the private market for investment purposes. For properties with leverage, returns are reported as if there were no leverage. Russell 3000 Index measures the performance of the largest 3000 U.S. companies representing approximately 98% of the investible U.S. equity market. Russell 1000 Index measures the performance of the large-cap segment of the U.S. equity market and includes approximately 1000 of the largest securities based on market capitalization and representing approximately 92% of the U.S. market. Russell 1000 Growth Index measures the large-cap growth segment of the U.S. equity market including Russell 1000 companies with higher price-to-book ratios and forecasted growth. Russell 1000 Value Index measures the large-cap value segment of the U.S. equity market including Russell 1000 companies with lower price-to-book ratios and lower expected growth. Russell Midcap Index measures the performance of mid-cap stocks in the U.S. equity market including 800 of the smallest securities in the Russell 1000® Index, based on market capitalization. Russell Midcap Growth Index measures the performance of the mid-cap growth segment of the U.S. equity market including Russell Midcap Index companies with higher price-to-book ratios and forecasted growth. Russell Midcap Value Index measures the performance of the mid-cap growth segment of the U.S. equity market including Russell Midcap Index companies with lower price-to-book ratios and forecasted growth. Russell 2000 Index measures the performance of the small-cap segment of the U.S. equity market including approximately 2000 of the smallest securities based on market capitalization. Russell 2000 Growth Index measures the performance of small-cap growth stocks in the U.S. equity market including Russell 2000 companies with higher price-to-value ratios and forecasted growth. Russell 2000 Value Index measures the performance of small-cap growth stocks in the U.S. equity market including Russell 2000 companies with lower price-to-value ratios and forecasted growth. S&P 500 Index is a widely regarded as the best single gauge of the U.S. equities market, including 500 leading companies in major industries of the U.S. economy. S&P/LSTA (Loan Syndications and Trading Association) Leveraged Loan Index (LLI) is a total return market value index that tracks fully funded, senior secured, first lien term loans syndicated in the U.S., as well as dollar-denominated overseas loans, including 90-95% of the institutional universe. The S&P GICS (Global Industry Classification Standard) sectors were developed by MSCI and Standard & Poor’s to provide standardized industry definitions consisting (in the U.S.) of 10 sectors, 24 industry groups, and 68 industries. Thomson VentureXpertTM is a database provided by Thomson Venture Economics, a leading provider of industry data about venture capital and private equity firms, which is regarded as the industry-standard source for comprehensive information on venture funds, private firms, venture-backed companies and limited partners, as well as analytics for fund statistics and performance. U.S. Treasury Index is a component of the Barclays Capital U.S. Aggregate Index.
Important Disclosures All indexes are unmanaged and an individual cannot invest directly in an index. Index returns do not include fees or expenses. Past performance is no guarantee of future results The views and judgments expressed are those of ING Global Perspectives. They are subject to change at any time. These views do not necessarily reflect the opinions of any other firm. All investing involves risks of fluctuating prices and the uncertainties of rates of return and yield inherent in investing. All security transactions involve substantial risk of loss. You should consult your tax, legal, accounting or other advisors about the matters discussed herein. As indicated on each page, some information was obtained from outside sources and is believed to be reliable, but ING does not guarantee its completeness or accuracy. Diversification does not guarantee against a loss and there is no guarantee that a diversified portfolio will outperform a non-diversified portfolio. PRINCIPAL RISKS: All investing involves risks of fluctuating prices and the uncertainties of rates of return and yield inherent in investing. Mutual funds are subject to market risk. Foreign Investing does pose special risks including currency fluctuation, economic and political risks not found in investments that are solely domestic. Please keep in mind, using diversification or asset allocation as part of your investment strategy neither assures nor guarantees better performance and cannot protect against loss in declining markets. Global Perspectives Market Models are tactically managed to a strategy. There is no guarantee that intended results or forecasts will be realized. Past performance is no guarantee of future results. Your clients should consider the investment objectives, risks, charges and expenses of the Fund carefully before investing. For a free copy of the Fund’s prospectus, which contains this and other information, visit us at www.inginvestment.com or call ING Investment Management at 1-800-992-0180. Please instruct your clients to read the prospectus carefully before investing.
This presentation has been prepared by ING Investment Management for informational purposes. Certain information may be received from sources ING Investment Management considers reliable; ING Investment Management does not represent that such information is accurate or complete. Nothing contained herein should be construed as (i) an offer to sell or solicitation of an offer to buy any security or (ii) a recommendation as to the advisability of investing in, purchasing or selling any security. Any opinions expressed herein reflect our judgment and are subject to change without notice. Certain of the statements contained herein are statements of future expectations and other forward-looking statements that are based on management’s current views and assumptions and involve known and unknown risks and uncertainties that could cause actual results, performance or events to differ materially from those expressed or implied in such statements. Actual results, performance or events may differ materially from those in such statements due to, without limitation, (1) general economic conditions, (2) performance of financial markets, (3) interest rate levels, (4) increasing levels of loan defaults (5) changes in laws and regulations and (6) changes in the policies of governments and/or regulatory authorities.The information provided regarding holdings is not a recommendation to buy or sell any security. Fund holdings are fluid and are subject to daily change based on market conditions and other factors. ING assumes no obligation to update any forward-looking information contained in this document. ING Investment Management is not soliciting or recommending any action based on any information in this document.Past performance is no guarantee of future results.CA:3706