Download
1 / 41
420 likes | 428 Views
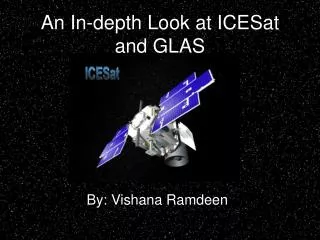
ICESat: Ice, Cloud and Land Elevation Satellite. Working Title: Lasers: The other light data. Thomas Herring, 54-618 Graduate Student An Nguyen and members of the GLAS Science Team tah@mit.edu http://www-gpsg.mit.edu/~tah. Overview. Science objectives of mission Mission design

E N D
ICESat: Ice, Cloud and Land Elevation Satellite Working Title:Lasers: The other light data Thomas Herring, 54-618 Graduate Student An Nguyenand members of the GLAS Science Team tah@mit.eduhttp://www-gpsg.mit.edu/~tah ICESat
Overview • Science objectives of mission • Mission design • Current status • Initial results ICESat
Science Objectives • CRYOSPHERE PURPOSE: • to determine the mass balance of the polar ice sheets and their contributions to global sea level change • to obtain essential data for prediction of future changes in ice volume and sea-level. • ATMOSPHERE & LAND PURPOSES: • to measure cloud heights and the vertical structure of clouds and aerosols in the atmosphere • to map the topography of land surfaces • to measure roughness, reflectivity, vegetation heights, snow-cover, and sea-ice surface characteristics. ICESat
Science Motivation • Status of Antarctic and Greenland ice sheets • Greenland and Antarctic ice sheets could be growing or shrinking • Uncertainty is ±30% of mass input; ±5 cm/yr average ice thickness; ±2.3 mm/yr global sea level change). • ICESat will measure < 1 cm/yr average ice thickness change • < 5% of mass input and < 0.4 mm/yr global sea level change). ICESat
Science Motivation • Future ice sheets changes • It is not known whether future changes in mass balance associated with climate warming will be positive or negative • Sensitivity perhaps - 10% to + 20% change in mass input/K temperature change = +0.8 mm/yr/K to - 1.6 mm/yr/K sea level change). • ICESat should measure changes in mass balance expected for 1 K polar warming (depends on sensitivity estimate) ICESat
Science Motivation • Ice sheet and Cloud characteristics • Measurement of elevation changes will provide early warning of possible instability of west Antarctic ice sheet (e.g. changes in ice-stream flow, critical ice-shelf grounding lines, ice-shelf rises, inland ice drawdown). • GLAS LIDAR will directly measure cloud heights, for energy balance calculations, and obtain unique information on polar clouds, especially during the polar winter. ICESat
Mission design • The primary instrument on ICESat is the Geoscience Laser Altimeter System (GLAS) • Instrument is mounted on a Ball “imaging platform” bus. • GLAS is “self contained” with its own star trackers and laser alignment calibration; the bus also has star trackers and gyroscopes for attitude determination and space craft pointing. ICESat
Design requirements • GLAS specifications: • Range accuracy: ±15 cm (slope <1o); ±22 cm slopes between 1-3o. • Mean elevations over 100x100 km regions ±1cm • Laser is diode pumped, Q-switched Nd:YAG laser with 40 Hz pulse repetition; 75 mJ at 1064 nm and 35 mJ at 532 nm • Receiver telescope is 1 meter diameter • Foot print 70 m diameter, 170 m along track spacing • GPS determined radial orbit error ±5cm • Attitude knowledge ±1.5 seconds; pointing ability 30 seconds (to allow repeat ground track ±60 m). ICESat
Range Measurement System • Return waveform is digitized at 1GHz rate (bins 15cm one-way range). • Over land and ice, 544 waveform samples are returned in level 0 data; over oceans 200 samples are returned (based on on-board DEM) • Multiple Gaussians are fit to the returned waveform with the most distant peak taken as ground return. (Algorithms still being fine tuned based on actual return waveforms). ICESat
GLAS Laser Pointing System • Because of the narrow laser beam, pointing knowledge is critical to GLAS. Specification is 1.5 second pointing knowledge. • Accuracy is achieved with the star camera (1Hz rate), gyroscopes (interpolation to 40Hz), and imaging of the laser beam (small pick off of outgoing pulses) in the star camera. • Bore sight direction was issue before launch (small field of view) and need to align optics in gravity field ICESat
ICESat artist’s conception ICESat
Fully Assembled ICESat • GLAS Instrument weight: 300 kg • Power 330 W • Thermal range 20±5C • Beam divergence 375 mrad. ICESat
ICESat Orbit • Orbit altitude 600 km • Inclination 94o • 8-day repeat during Calibration/Validation • 183-day repeat during mission (original plan). Likely to change to 90-day repeat • 3-yr lifetime, 5-yr desirable • 3 Lasers to meet lifetime requirements ICESat
Mission History • Launch: Jan 13,2003, Vandenberg AF base, Delta II launch vehicle. • Laser 1: Turn of Feb 20, 2003 • Laser 1: Failure March 29, 2003 • Originally expected Laser 2 turn on: Mid to late August 2003. • Inquiry board to study failure of laser 1. • Turn of laser #2: 13:11 today, data available 1 hour later (over Norway at the time of turn on). ICESat
Preliminary Results • Mission still in Calibration/Validation Phase and so all results are preliminary. • Laser failure occurred before green channel lidar detectors had out-gassed so lidar results will be based on the lower SNR 1064 nm channel. • Full attitude calibration has not yet been completed (i.e., pointing angles between laser and optical bench). ICESat
Calibration/Validation • Primary CAL/VAL target is White Sands, NM • Array of diode detectors to detect laser pulse • Array of corner cube reflectors (at different heights) that can be seen in return pulses • Photography of laser spots on ground • Due to laser failure, CAL/VAL has not been completed here • Other CAL/VAL: • Ocean sweeps (off nadir circular pattern on ocean surface) • Areas of calibrated DEMS for detailed comparison ICESat
Examples • GLAS Data releases 9 and 11 (changes as system better understood). Also results from release 12 (currently being distributed) • Attitude determination using “Ocean Scans”. Orientation angles, range and timing biases are determined from circular scan over the ocean (3-5 degrees off nadir). • Waveforms and altimetry over ice sheets. • Signal return strength and surface smoothness ICESat
High Freq. Attitude Error Improvement Release 9 Release 11 Night Day ICESat
Release 9 Elevation profiles showing that raising the signal threshold and fixing coding error to not use data for which Gaussian fitting was unsuccessful edited out bad data. Release 11 ICESat
Release 9 Release 11 Reduction from 6 to 2 peaks smoothes out some of the elevation Profile noise – saturation error still not accounted for ICESat
Release 9 – 6 peaks – fit looks Good – physical significance lost Release 11 – 2 peaks with last peak always kept and no sample weighting – misses main ground return Release 11+ - weighting forces better fit to leading edge; most significant peaks kept so one fits main ground return – still contains saturation error ICESat Effects of changes for saturated returns with forward scattering
Crossover Analyses • Crossovers: Interpolation to the same point for two crossing tracks. Initially useful for assessing data quality. Later crossovers can be “plotted” as a function of time separation of the tracks and rates of change of surface height deduced. • Because of the laser failure the current data sets are not fully calibrated. In particular, pointing knowledge of the laser is not as good as it should be • Examine: • Histograms of crossovers as functions of: • Angle separation of tracks • Surface slope differences (20 pts along track around crossover) • Surface RMS scatter (form 20 points) ICESat
Angle-separation binning • Notice as tracks become parallel RMS differences in crossovers decrease; suggesting pointing errors • Although near 180 degree crossover are at 86 degree latitude, smaller crossover angles are near the edges of the ice sheet ICESat
Slope-difference binning(slopes from 20-points in each track) • Notice linear trend as function of slope difference: suggests pointing error (~23 meters on ground) • <60 cm RMS at near zero degrees slope difference giving indication of data quality Dslope (deg) ICESat
20-point linear-fit RMS binning • Indicates precision of instrument: larger number of points with <20 cm RMS scatter about linear trend along track for 3.4 km • Lowest RMS values: 2.5 cm Binning changeshere ICESat
Signal Strength Studies • Three class of studies carried out • Peak received voltage. Large percentage are reaching limit of 1.5 volts, peaks in Gaussians have similar (and often larger values). • Area under the received waveform. • Three basic classes of large areas: • Strong sharp pulse • Long duration pulses with relatively low amplitude but integrate to large area (clouds) • Not clear cases: Large area, by short pulse with moderate amplitude • Slopes of smooth terrain (defined by small RMS fit to linear trend over 1-sec). ICESat
Peak signal Voltage ICESat
Histogram of Max Received Signal Fully Saturated pulses ICESat
Signal Strength and surface shape • The peak return voltage is clearly being clipped and the often even over clouds we are seeing very strong returns (although often with long return pulses) • Integrated power under waveform is also large although the distribution in deceasing with increasing size • No re-normalization for receiver gain yet. (Scaling of gain counts?) • Now examine surface slope and RMS fit to 1-sec data. Looking for areas of specula reflections. ICESat
Ground tracks March 22, 2003 ICESat
GLA06_030316 Ground Track ICESat
GLA06 elevation plot ICESat
GLA06 Slope and RMS Analysis • Analysis looks at the slope and RMS of GLA06 elevation values by taking the data in 1-sec samples and fit a linear trend and computing the RMS about the trend. • Most of the RMS fits < 20 cm are over the oceans and so far all the slopes have been small (<10 milli-deg). RMS can be as low as 25 mm over calm oceans. • Slopes comparable to the ICESat off-nadir pointing angle and small RMS seen on ice sheets and some continental areas. If these surfaces are capable of specula reflections then slopes are a problem (Damage to detectors possible). ICESat
RMS and Slopes ICESat
Zoom ice area ICESat
High slope area of ice sheet ICESat
Signal Strength Summary • Signal Strengths • 9-10% of pulse reach the 1.5Volt limit on return signal strength • Issue with maximum possible signal at detectors: • Gain changes not accounted for yet (need to know scaling): Concern if gain high and strong returns comes in • Many areas of 2-20cm elevation RMS; many in oceans where slopes seems too small to cause specula reflection problems but some on ice sheets where slopes can be similar to current off-nadir pointing angle. ICESat
Current Issues • Link budget better than expected: End result is saturation of pulses: • Fitting of Gaussians can detect “ringing in detectors” and yield a return from below the surface • Forward scattering in the atmosphere leads to non-symmetric pulses that can bias Gaussian fits • Jitter in the attitude system; 0.6 Hz oscillation that may be due to loose solar panel connection (not clear yet) • Ability to point to ±60 m on the ground not yet confirmed (need laser running to be certain) • Lidar green channel detectors not turned on yet (need laser) ICESat
Conclusions • So far data collected with ICESat has been of very high quality but because of laser failure absolute calibration not yet completed. • High signal strengths are causing saturation on about 10% of pulses: Next laser turn on will be at lower temperature and less power. Waveform processing is being modified to account for signal strength. • Confident that lasers 2 and 3 will run at least as long as laser 1; final assessments are being made to ensure longer lifetimes of these lasers. • Hopefully laser 2 fired successfully during this talk. ICESat