Download
1 / 49
560 likes | 848 Views
Data assimilation of polar orbiting satellites at ECMWF. Tony McNally ECMWF. Overview. Data assimilation Radiance observations from polar orbiting satellites scientific challenges. Main areas of activity at ECMWF. Numerical Weather Prediction (NWP). Environmental monitoring and

E N D
Data assimilation of polar orbiting satellites at ECMWF Tony McNally ECMWF
Overview • Data assimilation • Radiance observations from polar orbiting satellites • scientific challenges
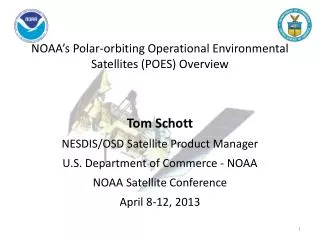
Main areas of activity at ECMWF Numerical Weather Prediction (NWP) Environmental monitoring and modelling Historical reanalysis for climate research
Numerical Weather Prediction (NWP) Deterministic Monthly Seasonal
Environmental monitoring and modelling Estimating greenhouse gas concentration and flux inversion Monitoring and forecasting trajectory of dust events Monitoring and forecasting trajectory of volcanic events
Re-analysis for climate research Trend analysis of climate parameters Improved climatology for process studies Cleansed historical observation data sets
Numerical Weather Prediction (NWP) Environmental monitoring and modelling Historical reanalysis for climate research
Numerical Weather Prediction (NWP) DATA ASSIMILATION Environmental monitoring and modelling Historical reanalysis for climate research
What is data assimilation ? …in essence data assimilation is the combination of information from a model and observations to produce a best estimate of the state of the atmosphere (the analysis) ….
Forecast model Observations Assimilation algorithm Super-computer Key elements of the assimilation system:
The forecast model Xt=0 Xt=t
The forecast model Physical and dynamical processes updated every 10 minutes Global T1279 spectral resolution (16km grid point spacing) 91 vertical levels from the surface to 0.01hPa (approx: 80Km)
The forecast model 6,300,000,000,000,000 floating point operations for a single 10 day forecast Global T1279 spectral resolution (16km grid point spacing) 91 vertical levels from the surface to 0.01hPa (approx: 80Km)
The Observations Yobs
Operational Global Observing Network ~ 60,000,000 observations used every 12 hours
Super computer configuration June 2010
Some of the most important satellite instruments for NWP… On NOAA / NASA / EUMETSAT polar orbiting spacecraft High resolution IR Sounder (HIRS), Advanced Microwave Sounding Unit (AMSU), Atmospheric IR Sounder (AIRS), Infrared Atmospheric Sounding Interferometer (IASI), Advanced Microwave Scanning Radiometer (AMSR), TRMM (TMI), Cross-track Infrared Sounder (CrIS) On DMSP polar orbiting spacecraft Special Sensor Microwave Imager (SSMI,SSMI/S) Note: the vast majority of data comes from near-nadir passive sounders
Example of a modern satellite sounding instrument… IASI 8461 infra-red radiances measured by the IASI instrument
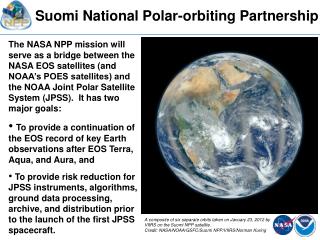
What benefits do polar satellite observations bring to NWP ?
Forecast skill without polar satellites ? Anomaly correlation geopotential height 500 hPa S.H.: ~3 days at day 5 Anomaly correlation geopotential height 500 hPa N.H.: ~2/3 to 3/4 of a day at day 5
Forecast skill without polar satellites ? Snowfall forecasts over North Eastern USA, 3 days in advance of the 19th December 2009 at 12z. The assimilation system with NO POLAR SATELLITES fails to predict the snow storm that caused widespread disruption to the US east coast. Contours start at 5cm and are at 5cm intervals. Red indicates more than 20cm. NO POLAR ECMWF OPS VERIFICATION
Forecast skill without polar satellites ? Forecasts of Mean Sea Level Pressure, 5 days in advance of the 30th October 2012 for the landfall of Hurricane Sandy. Forecasts from an assimilation system with no polar satellites fails to predict the correct landfall of the storm that caused widespread damage and loss of life to the US east coast. ECMWF OPS NO POLAR SAT VERIFICATION 5 day forecast: Base time 2012-10-25-00z Valid Time: 2012-10-30-00z
What do these instruments measure ? They DO NOT measure TEMPERATURE They DO NOT measure HUMIDITY or OZONE They DO NOT measure WIND …these instruments measure the radianceL that reaches the top of the atmosphere at given frequencyv… …ECMWF assimilates these radiances directly (not retrievals of temperature, humidity etc…)
The radiative transfer equation measured by the satellite Our description of the atmosphere Surface reflection/ scattering Surface emission Cloud/rain contribution + + + +... Planck source term* depending on temperature of the atmosphere Other contributions to the measured radiances Absorption in the atmosphere The RT equation is part of the 4DVar operator that maps the model state X vector into the observation space Y
Specific Science Challenges • Limited vertical resolution • Sensitivity to cloud and rain • Systematic error
1. Limited vertical resolution Absorption Pressure o1 2 Frequency Transmission Weighting function
1. Limited vertical resolution AMSUA 15 channels IASI 8461 channels
1. Limited vertical resolution If we consider the assimilation of these radiances as correcting errors in the background state, the success will depend crucially on the size and vertical structure of the background errors (EDA / EnKF etc…)
2. Sensitivity to cloud and rain measured by the satellite Our description of the atmosphere Surface reflection/ scattering Surface emission Cloud/rain contribution + + + +... The cloud uncertainty in radiance terms may be an order of magnitude larger than the T and Q signal (i.e. 10s of kelvin compared to 0.1s of Kelvin!
Weighting function non-linearity dR/dT500 = 0 dR/dT* = 1 dR/dT500 = 1 dR/dT* = 0 full cloud at 500hPa surface surface
Sensitive areas and cloud cover Location of sensitive regions Summer-2001 (no clouds) sensitivity surviving high cloud cover monthly mean high cloud cover sensitivity surviving low cloud cover monthly mean low cloud cover From McNally (2002) QJRMS 128
Forecast impact from cloudy data! Cloud obscured singular vector ? 500hPa analysis difference (K) Some extra overcast observations are used – leading to some possibly important analysis differences in a sensitive area …
3. Systematic error (global influence)
3. Systematic error … data Globally averaged bias correction estimates for MSU channel 2 Warm-target temperatures for MSU on NOAA-14
3. Systematic error … model Shifts in upper-stratospheric temperature reanalysis Global mean temperature anomalies in the upper stratosphere JRA-25 The transition from SSU Ch3 to AMSU-A Ch14 is clearly visible in global mean temperatures at 5hPa and above ERA-Interim ERA-40 The use of weak-constraint 4D-Var can (only) partially address this problem This problem cannot be completely solved unless the forecast model is free of bias NCEP
3.Systematic error..atmosphere Response to Pinatubo: HIRS Ch11 bias corrections Bias corrections for HIRS Ch11 (tropical averages) • Volcanic aerosols in the lower stratosphere: • Cooling effect on radiances • Not represented in radiative transfer model • ERA-Interim: Change the bias correction • ERA-40: Change the humidity increments • Bias corrections for NOAA-12: • In ERA-Interim, correct initialisation followed by a gradual recovery • In ERA-40, bias held fixed
Summary • Data assimilation lies at the centre of NWP, climate re-analysis and environmental monitoring • Radiance observations from polar orbiting satellites are the single most influential component of the global observing system • Great progress has been made, but significant scientific challenges remain to advance the use of these observations
The 4D-Var Algorithm Cost function: Solution: Correction term Solution error covariance: HB Sa = B -