Download
1 / 14
140 likes | 147 Views
Explore the integration of folksonomies, social tagging, and visualization techniques to enhance library catalogs. Discover how tools like Digg Labs Stack, SpaceNav, and TagGraph can improve the user experience and provide valuable insights into item reviews, popularity, and user engagement.

E N D
Folksonomies, Social Tagging, and Library Catalogs By: Niki Kranich Information Visualization (554) May 6, 2008
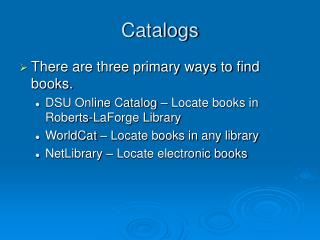
Three programs • Digg Labs Stack • http://labs.digg.com/stack • SpaceNav • http://www.ivy.fr/revealicious/demo/spacenav.html • TagGraph • http://www.taggraph.com
Real time activity Digg Labs Stack 100 stories Color & motion
Digg Labs Stack • Diggers (circled in red) • They represent a story being “dug”, falling from the top of the screen. They increase the length of the bar they fall on. • Colors • The more popular stories are a brighter shade of green.
Digg Labs Stack Stories are also color coded with more popular stories being green. Users can also hover over the bars to see which story they reference, as seen above.
SpaceNav How popular are del.icio.us tags in relation to other tags?
SpaceNav Highlighting is used to show the user which tag they are currently viewing. Direct Manipulation: the user can drag the items all across the workspace, including into the tag list area.
SpaceNav History is shown by the white lines hiding beneath the main picture, by virtue of occlusion. If the user hovers of the (red) circled white node, the system shows them both where the tag is in the alphabetical list, along with where the tag is visually in the workspace.
TagGraph Zooming: Users have the option to zoom in and out to see more of the workspace Users can display more images by clicking on more images Related tags: Clicking on this shows the tags of all the “green” images. Users can then click on the tag keywords to view more images with that keyword.
TagGraph Drawbacks: The system tends to crash easily. Here the user is looking at 63 images, with an option to look at up to 21,000+ images. Asking the system to display all the tags for each of the 63 pictures generally crashes the system, giving the user an error.
Tying it all together: folksonomies and libraries Lamson Library’s catalog Ann Arbor Library District’s tag cloud
Tying it all together: folksonomies and libraries • What if patrons could visually see the relationship between catalog items, such as in TagGraph or SpaceNav? • What if patrons could see reviews of cataloged items, such as in Dig Labs Stack? • For instance. . . • Which items get the most reviews? • Which users give the most reviews? • Which items are most popular within the catalog?
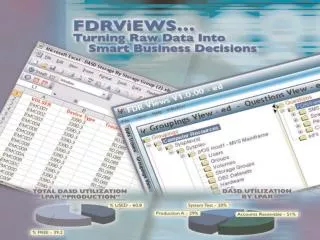
Information Visualization and Libraries . . . . . . Where can we, as information professionals, go from here?


![Library Catalogs & [Other] Databases](https://cdn1.slideserve.com/2480230/library-catalogs-other-databases-dt.jpg)