Download
1 / 13
130 likes | 228 Views
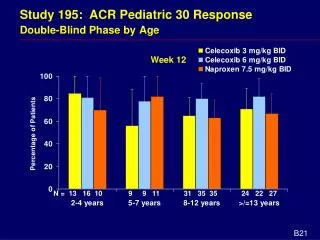
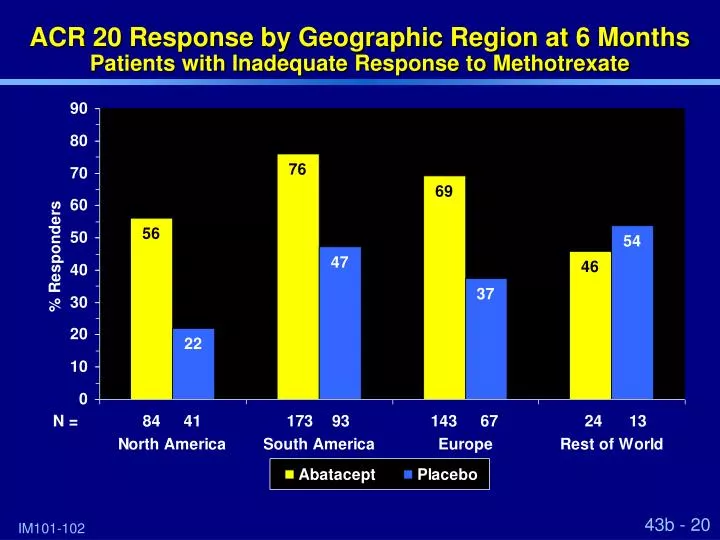
ACR 20 Response by Geographic Region at 6 Months Patients with Inadequate Response to Methotrexate. N = 84 41 173 93 143 67 24 13. 43b - 20. IM101-102. ACR 20 Response by Geographic Region at 6 Months Patients with Inadequate Response to Anti-TNF Therapy. N = 187 99. 69 34. 44b - 19.

E N D
ACR 20 Response by Geographic Region at 6 MonthsPatients with Inadequate Response to Methotrexate N = 84 41 173 93 143 67 24 13 43b - 20 IM101-102
ACR 20 Response by Geographic Region at 6 MonthsPatients with Inadequate Response to Anti-TNF Therapy N = 187 99 69 34 44b - 19 IM101-029
Overview of Adverse Events by AgeDouble-Blind, Controlled Study Periods Number (%) of Patients < 65 years 65 years Abatacept N = 1632 PlaceboN = 841 Abatacept N = 323 PlaceboN = 148 1447 (88.7) 188 (11.5) 40 (2.5)9 (0.6) 78 (4.8) 6 (0.4) 710 (84.4) 98 (11.7) 15 (1.8)7 (0.8) 29 (3.4) 5 (0.6) 289 (89.5) 78 (24.1) 18 (5.6)17 (5.3) 29 (9.0) 4 (1.2) 130 (87.8) 24 (16.2) 4 (2.7)4 (2.7) 10 (6.8) 1 (0.7) AEs SAEs Serious Infections Malignancies Discontinuation due to AE Death BLA/4M 65b - 3
Abatacept Abatacept Placebo Placebo ACR 20 Response at 6 Months by AgeDouble-Blind, Controlled Study Periods Methotrexate Inadequate Responders Anti-TNF Inadequate Responders Percent Responders Percent Responders N = 359 188 65 26 N = 205 113 51 20 Patients< 65 years Patients 65 years Patients< 65 years Patients 65 years IM101-102 and IM101-029 65b - 2
Varicella – Cases of Special InterestDouble-Blind and Open-Label Cases All Cases resolved appropriately per investigator 62c - 6
Measures to Evaluate Effects of Abatacept on the Developing Immune System 30b - 2
Effects on Developing Immune System3-Fold Clinical Exposure 30b - 3
Effects on Developing Immune System11-fold Clinical Exposure 30b - 4
Anti-Nuclear and ds-DNA AntibodiesSeroconversion by 6-Month Intervals Population: Double-blind, Phase III studies BLA 64a - 5
Antibody Response to VaccinationStudy Design • Single Dose Study: open-label, randomized, parallel-groups • 4 treatment groups (20 healthy volunteers per group): • Antibody levels evaluated at: • Baseline • 14 days post-vaccination • 28 days post-vaccination 24 - 3 IM101-049
EULAR Disease Activity Outcomes (DAS 28 – ESR)Patients with Inadequate Response to Methotrexate 6 Months 1 Year ** ** ** ** ** p <0.001 LOCF Analysis • Low Disease Activity: ≤ 3.2 • Remission: < 2.6 43b - 49 IM101-102
Abatacept Placebo Mean Values of Biomarkers at 6 MonthsPatients with Inadequate Response to Anti-TNF Therapy Pro-inflammatory Cytokines Proteolytic Enzyme MMP-3 TNF-α p = 0.019 p < 0.001 Normal Range Normal Range B/L 6 Mo B/L 6 Mo B/L 6 Mo B/L 6 Mo Autoantibody IL-6 Rheumatoid Factor p < 0.001 p = 0.014 Normal Range Normal Range B/L 6 Mo B/L 6 Mo B/L 6 Mo B/L 6 Mo B/L = baseline value 44b - 67 IM101-029
Mean Changes in Total Radiographic Scores at 1 YearSubgroup AnalysisPatients with Inadequate Response to Methotrexate Placebo Better Abatacept Better Treatment Difference with 95% CI 43b - 76 IM101-102