Download
1 / 17
170 likes | 331 Views
National Aeronautics and Space Administration. The CrIS Instrument on Suomi -NPP. Joel Susskind NASA GSFC Sounder Research Team (SRT) Suomi -NPP Workshop June 21, 2012 Washington, D.C. www.nasa.gov. Cross Track Infrared Sounder CrIS.

E N D
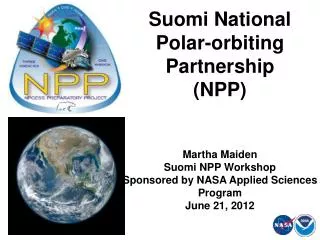
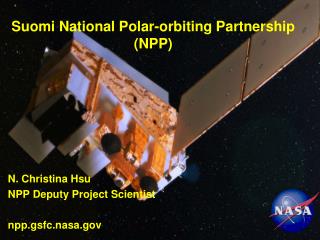
National Aeronautics and Space Administration The CrIS Instrument on Suomi-NPP Joel Susskind NASA GSFC Sounder Research Team (SRT) Suomi-NPP Workshop June 21, 2012 Washington, D.C. www.nasa.gov
Cross Track Infrared Sounder CrIS CrIS is the infrared high spectral resolution atmospheric sounder on Suomi-NPP: 1305 channels between 650 cm-1 and 2550 cm-1. CrIS/ATMS comprise the IR/MW Sounding Suite on NPP called CrIMSS. CrIS is functionally equivalent to AIRS, the high spectral resolution IR sounder on EOS Aqua and ATMS is functionally equivalent to AMSU on EOS Aqua. CrIS is an interferometer and AIRS is a grating spectrometer. • Spectral coverage, spectral resolution, and channel noise of CrIS is similar to AIRS. CrIS spectral sampling is roughly twice as coarse as AIRS. AIRS has 2378 channels. • Spatial resolution of CrIS is comparable to AIRS. Field of View (FOV) is ≈ 15 km x 15 km at nadir. Joel Susskind
CrIS/ATMS Soundings (EDRs) Atmospheric soundings are produced using simultaneous observations from CrIS/ATMS. As with AIRS/AMSU, one sounding is produced for each 3x3 array of CrIS (or AIRS) Fields of View (FOVs), called a Field of Regard (FOR). All products produced from AIRS/AMSU can be produced from CrIS/ATMS. The next charts demonstrate potential CrIS/ATMS capability by showing AIRS/AMSU results. CrIS/ATMS products should be of comparable accuracy to those of AIRS/AMSU when generated using an analogous retrieval algorithm. Joel Susskind
AIRS/AMSU Retrieval Methodology Physically based retrieval system. Uses cloud cleared radiances Ri to sequentially determine the solution for different geophysical parameters. Ri represents what AIRS would have seen in the absence of clouds. All AIRS/AMSU retrievals have error estimates which are used for Quality Control (QC). Goddard DISC has been analyzing AIRS/AMSU data using the AIRS Science Team Version-5 retrieval algorithm. Retrievals are near real time. Analyzed data from September 2002 through the present. AIRS Version-6 will become operational in August 2012 for forward processing and re-processing. Joel Susskind
AIRS/AMSU Level-2 Products Surface and Atmospheric Products – one set per FOR (45 km) Sea/land skin temperature Ts Temperature profile T(p) to 1 mb Water vapor profile q(p) to 200 mb O3, CO, CH4,CO2 profiles Cloud Cleared Radiances Ri Cloud Products – one set per AIRS FOV (13 km) Effective cloud fraction αεfor up to two cloud layers α is geometric fractional cloud cover εis cloud emissivity at 11 µm Cloud top pressure pc for up to two cloud layers OLR is computed using αε, pc, and retrieved parameters Clear Sky OLR is computed using retrieved parameters with αε = 0 Joel Susskind
Objectives of AIRS/AMSU (CrIS/ATMS) • Provide real time observations to improve numerical weather prediction, (NWP) including track and intensity of severe storms Could be Ri (used by NCEP, ECMWF) or T(p), q(p) Accuracy of Ri T(p), q(p) degrades slowly with increasing cloud fraction There is a trade-off between accuracy and spatial coverage Using soundings or radiances only in clear cases limits utility of the data for NWP purposes • Provide observations to measure and explain interannual variability and trends Must provide very good spatial coverage but also be unbiased Can be less accurate than needed for data assimilation Error estimates and quality flags provide options for use in either weather or climate applications. AIRS trace gas products are relevant with regard to Air Quality. Joel Susskind
AIRS/AMSU Version-5 Quality Control All AIRS/AMSU retrievals and cloud cleared radianceshave level-by-level and channel-by-channels error estimates. Thresholds of error estimates are used for Quality Control of all retrievals. Version-5 used Standard Quality Control Thresholds, chosen to give a middle ground for Data Assimilation (accuracy) and Climate (spatial coverage): It was optimized for neither application. Version-5 Level-3 1˚x 1˚ gridded products use cases accepted with Standard QC thresholds: Daily, 8-day mean, Monthly mean. Version-6 has further improvements, including separate sets of thresholds optimized for Weather and Climate and Air Quality applications. Version-6 Level-3 1˚x 1˚ gridded products use cases accepted by Climate QC thresholds. Joel Susskind
AIRS Global Temperature Profile Statistics Percent of All Cases 1 Km Layer Mean Temperature (°K) Accepted RMS Differences from ECMWF Version-6 Climate QC retrievals have significantly higher yield and better accuracy than Version-5. Joel Susskind
AIRS Global Water Vapor Profile Statistics 1 Km Layer Precipitable Water Percent of All Cases Accepted RMS % Differences from ECMWF Version-6 Climate QC lower tropospheric q(p) is more accurate than Version-5 with higher yield Joel Susskind
Sample AIRS V6 Level-3 Products for September 29, 2004 1:30 PM Cloud Parameters αε(%) and pc(mb) Outgoing Longwave Radiation(W/m2) Global Mean = 44.33 Standard Dev = 30.90 % Grid Filled 88.99 Global Mean = 244.22 Standard Dev = 47.33 % Grid Filled 88.99 Total Precipitable Water (cm) Surface Skin Temperature (K) Global Mean = 2.17 Standard Dev = 1.59 % Grid Filled 86.22 Global Mean = 290.17 Standard Dev = 15.55 % Grid Filled 76.14 Joel Susskind
Sample AIRS V6 Level-3 Products for September 29, 2004 1:30 PM Total Precipitable Water 500 mb to top (mm*10) 500 mb Temperature (K) Global Mean = 257.70 Standard Dev = 10.19 % Grid Filled 88.62 Global Mean = 10.28 Standard Dev = 11.81 % Grid Filled 88.62 CO (ppm) Ozone (DU) Global Mean = 289.69 Standard Dev = 41.20 % Grid Filled 86.22 Global Mean = 0.086 Standard Dev = 0.020 % Grid Filled 86.22 Joel Susskind
Example of AIRS Climate Research using Version-5 Products AIRS and CERES Level-3 products cover the period September 2002 through June 2011. Eight-year monthly climatologies were generated for each 1˚x 1˚ grid box by averaging data for eight Januaries, eight Februaries, …… The monthly anomaly for each grid box is the difference of the monthly mean value for that month from its climatology. The Average Rate of Change (ARC) for a grid box is the slope of the straight line passing through the monthly anomaly time series. An area mean ARC is the cosine latitude weighted average ARC over the area. The El Niño Correlation (ENC) for a given grid point is the temporal correlation of the anomaly time series for that grid point with the El Niño Index. ENCs should be less time period dependent than ARCs. Joel Susskind
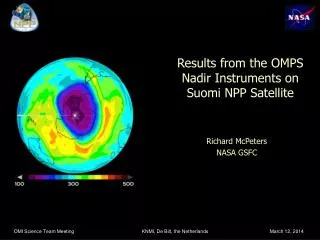
AIRS CERES AIRS minus CERES 1.5 times the El Niño Index El Niño Index ARC = -0.123 ± 0.046 K/yr AIRS CERES AIRS minus CERES OLR Anomaly Time Series September 2002 through June 2011 Global Mean Tropical Mean Joel Susskind
AIRS and CERES global mean and tropical mean anomaly time series agree very closely with each other Both show that global, and especially tropical, mean OLR have decreased over the time period under study OLR outside Regions 1 and 2 have not been decreasing – see next chart OLR Anomaly Time Series Comparison September 2002 through June 2011 Joel Susskind
September 2002 through June 2011 CERES OLR ARC (W/m2/yr) AIRS OLR ARC (W/m2/yr) Region 1 Region 2 CERES OLR ENC AIRS OLR ENC Global Mean = -0.094 STD = 0.82 Global Mean = -0.059 STD = 0.82 Global Mean = 0.03 STD = 0.36 Global Mean = 0.04 STD = 0.33 AIRS and CERES agree closely on 1˚ spatial scale OLR ARCs are very negative over Regions 1 and 2 OLR ENCs are very positive over Regions 1 and 2 Joel Susskind
SDR and EDR Products and Availability • CrIMSS T(p), q(p), and O3 (p) EDRs will be produced at the IDPS using an operational algorithm provided by Industry. NOAA STAR will also produce CrIMSS EDRs using an algorithm (NUCAPS) somewhat analogous to the AIRS Science Team Version-5 retrieval algorithm. NUCAPS data contains all products currently generated using AIRS/AMSU. CDR gridded products generated from both sets of EDR’s will be produced at the Sounder PEATE. CrIS SDRs are in the form of unapodized radiances. A simple subroutine is available to generate Hamming apodized radiances which are more analogous to AIRS radiances, as well as Blackman-Harris apodized radiances. SDRs and both sets of EDRs will be available at NOAA CLASS. • NASA is developing a CrIMSS retrieval algorithm analogous to AIRS Science Team Version-6. This algorithm will be developed and tested at NASA SRT. Level-2 (EDR) and Level-3 (CDR) products will be generated at the Sounder PEATE for a number of months and evaluated for possible eventual long term processing purposes. As of this time, there is no long term commitment to generate CrIMSS products using the SRT algorithm. Joel Susskind
SignOffPage Joel Susskind