Download
1 / 39
390 likes | 537 Views
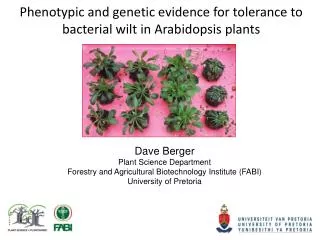
Phenotypic variations in a monoclonal bacterial population. Oleg Krichevsky , Itzhak Fishov, Dina Raveh, Ben-Gurion University, Beer-Sheva J. Wong, D. Chatenay, M. Poirier, S. Ghozzi, J. Robert Laboratoire Jean Perrin, FRE 3132 CNRS-UPMC 24 rue Lhomond, 75005 Paris. 4 µm.

E N D
Phenotypic variations in a monoclonal bacterial population Oleg Krichevsky, Itzhak Fishov, Dina Raveh, Ben-Gurion University, Beer-Sheva J. Wong, D. Chatenay, M. Poirier, S. Ghozzi, J. Robert Laboratoire Jean Perrin, FRE 3132 CNRS-UPMC 24 rue Lhomond, 75005 Paris
4 µm Electronic microscopy Escherichia Coli Bacteria 1 colonyin phase contrast microscopy
Schematic bacterium Membrane (glycolipide) • Cytoplasme (H2O+ions monovalents et divalents) • Acides nucléiques (ADN, ARN) • protéines (enzymes dont polymérases) • small molecules(ribosome) • Small numbers of molecules (par ex. 1 chromosome, 10-10000 ARNs; protéines). • Dynamic enzymatic reaction: production, transformation, • degradation of the species with time.
1) Central dogma: Protéine: un gène ADN chromosome ARNm ARNpolymérase ribosome transcription translation 2) DNA replication ADNpolymérase, gyrase… Bacterium Biochemistry (simplified!)
t Bacterial culture Growth by division: 1 bacterium→2 daughter bacteria genetically identical (clone) Duplication, repartition of the constituants (in particular of the chromosome) Division time: 30’à 37°C in nutritive medium(pH~7, protéines, glucides)
Culture of a single colony in homogenous medium, obtain a monoclonal population (typically: 1ml de medium grown 12 hours~108 bacteria). J. Spudich et D. Koshland revealed the individual character of chemotactism. (Nature 262 1976) Mutations don’t explain this individuality→ non geneticorigin. (mutation rate: 10-10/pb/génération) The authors invoked fluctuations of the small number of particle, of chemical rates to explain those non genetic variability. This process is more efficient than mutation to allow species adaptation to rapidly fluctutating environnment. Population/individual
Dégradation gR Dégradation gP Genetic expression network: • ADNARNProtéine (fluorescente) Example with a negative feedback loop: Gène ADN Promoteur Taux de transcription kR ARN Taux de traduction kP Protéine
Fluctuations. Network noise. Variability. • Ozbudak et al.: origin of the protein noise expression: transcription/translation Nature genetics 31 (2002). • Elowitz et al.: Intrinsic noise(Fluctuations des éléments du réseau)/extrinsic noise(fluctuations des autres composants de la cellule)Science 297 (2002). • Influence of the regulation mechanism
DNA in bacterium 1 chromosome (4 Mpb) N (1<n<300) plasmid copy number (entre 2 kpb et 100 kpb)
Replicon résistance antibiotique Plasmid • extrachromosomal DNA fragment • Code for its copy number (replicon sequence: ori, regulation) • Uses the host to replicate • Adds an advantage against otherwise toxic medium (Antibiotic resistance.) • Symbiotic plasmid/bacterium association
Partition system Without partition system With partition system
Plasmid copy number (PCN) inE. Coli PCN=phenotype choice Measured individual PCN on population scale(~104 individus) Distribution : variability Antibiotic resistance: adaptability <n> s Standard deviation
Direct Visualisation directe of plasmids in bacteria: G. Scott Gordon, Dmitry Sitnikov, Chris D. WebbOgden Aurelio Teleman, Aaron Straight, Richard Losick, and Schaechter, Schaech Andrew W. Murray, and Andrew Wright, Cell 1997. Fluorescent protein bounds to the plasmid sequence Disadvantage: homologous recombinaison
Indirect Method • Fluorescent protein mOrange coded by the plasmid • [protein] plasmid copy number • Fluorescent intensity bacteriaPCN • Expression copie unique sur le chromosome protéine verte. • Fluorescent gene expression under IPTG inducible tac promoter.
Promoter choice fluorescent gene Termination seq Promoter tac fluorescent gene Termination seq Promoter RNA-polymerase RNA-polymerase LacI repressor→no transcription, no gene expression IPTG LacI repressor titration→transcription, gene expression Strong induced promoter: minimise expression noise (Elowitz et al.)
Phase contrast Fluorescent image Measure the fluorescent intensity • Measurement over a population~104, every individual at the same developpment • Low level fluorescence • →Flow cytometry+fluorescentmicroscopy set up
Set up: cell optic detection
Soft lithography microchannel UV exposure Mask photosensitive resin glass develop, fix Ready to use channel Spread PDMS, bake at 90° C Unmold, fix on a cover glass
Optical differentiel Interferometry profilometry image of the channel(z=2µm) Field of view: 10µm Bacterial speed: ~0.1-1 mm/s
FV FO Time series of fluorescent intensity FV = PV + AV FO = aPO + AO + bPV Fi: i channel measure of fluorescent intensity Pi: i protein fluorescent intensity Ai: i channel autofluorescent intensity a: normalization constant between green and orange fluorescence b: leak of green toward orange channel Rq: a posteriori, no orange to green
Bacteria in exponential phase →reproductibility • No protein production • Fluorescence level Bacteria preparation(E. Coli TOP10 strain) • Culture 37°C 12h of a clone picked on a petri dish • Dilution 500X, re culture→DO=0.2 • Re dilution 100X, re culture →DO=0.2 • Induction 1h 1mM IPTG →protein fluo. production • Bloque chloramphénicol →stop protein production • Wash phosphate buffer, 12h. Protein maturation • Limit autofluorescence
Calibration • "Green" bacteria no plasmid Induced: leak gren→orange,b=0.17 Non induced :autofluorescence
3. Fluorescent gene in 1 et 2 copies on a plasmid 2. "Orange" bacteria, no plasmid (b=0) Coefficient a=0.58 Linearity between gene copy number and protein expression
R1+:partition system R1-:without partition system Study as a function of the replicon(ampicillin resistance) • F: single copy, partition system • R1: low copy number • ColE1: medium copy number, no partition system Hypothesis: On average gene expression does not depend on the copy nor its origin ≈constant Mean plasmid copy number per chromosome We take <nC>=1,7 (E. Coli and Salomonella, p.1553, ASM Press, 1996)
Variance et variability Poisson ColE1 R1's F Hypothesis on correlation and autoforrelation of fluorescent protein expression [ <PaPb>, (a,b=O,V)] h=s/<nP>
without, 99 générations without, 54 générations with Diminution de la Population N+ with plasmid diminishes Population N- without plasmid increases R1- plasmid loss Bacteria are cultivated without antibiotic for many generations
We measure N+(54)=60%, N+(99)=16% We deduce: population + division time est higher than 2 min. compared to population – Loss rate/bacterium/generation: 0,5% Loss rate Boe et Rassmussen, plasmid, 36,p.153 (1996)
Protein ADN chromosome ARNm ARNpolymérase ribosome transcription traduction Numerical simulations 10 réactions biochimiques Rµ: *X0 -> X1 R0 : free promoter -> RNAP bound promoter * X1 -> X0 R1 : unbinding of RNAP freeing promoter * X1 -> X2 + X0 R2 : transcription initiation * X2 -> X3 R3 : transcription, X3 = mRNA * X3 -> Ø R4 : mRNA deggradation * X3 -> X4 R5 : reversible mRNA/ribosome complex formation * X4 -> X3 R6 : reversible mRNA/ribosome complex dissociation * X4 -> X5 + X3 R7 : Translation start freeing RBS * X5 -> X6 R8 : production of protein X6 * X6 -> Ø R9 : protein degradation Siggia et al., PNAS October 1, 2002 vol. 99 no. 20 12795
Stochastic simulations • We have M reactions Rµ (m=1,2,…,M) involving N species. • We define P(t,µ)dtas the probability that the next reaction in [t+t, t+t+dt] is reaction Rµ. • One can show that: • cµdt = average probability, to first order in dt, that a particular combination of • Rµ reactant molecules will react accordingly in the next time interval dt. • hµ = number of distinct molecular reactant combinations for reaction Rµ found to • be present in V at time t. • (Daniel T. Gillespie, JOURNAL OF COMPUTATIONAL PHYSICS 2, 403-434 (1976)) • Example: • X1 + X2 -> X3 h = X1X2 • 2X -> Y h = X (X-1)/2 • Implementation: one has to generate (t,µ) according to P(t,µ) • in order to update at each step the number of reactant molecules implied in • reaction m.
Daniel T Gillespie, J. Phys. Chem., 1977, 81 (25), 2340-2361
Conclusion • Build up tools in molecular biology, optic and microfluidic to measure variability in bacterial population • Application: plasmid copy number measurement • F: single copy, strictly regulated • R1: partition System1) lowers PCN and 2) lowers variability • ColE1: high pcn but low variability • Plasmid loss rate in absence of partition system • Plasmid metabolic cost: increase in division time
Poubelle Réservoir 2 Perspectives • Synchronisation of bacterial population • Antibiotic concentration effect • Sorting: • Other toxic gene to test variability Thank you for your attention