Download
1 / 24
240 likes | 356 Views
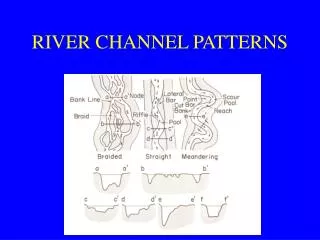
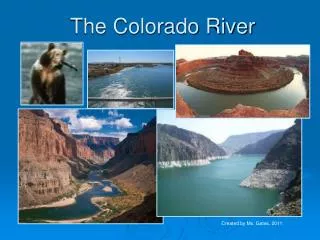
Main Channel and Near-shore Warming of the Colorado River Under Low Steady Flows. Bill Vernieu Grand Canyon Monitoring & Research Center US Geological Survey Flagstaff, AZ. Mainstem Warming.

E N D
Main Channel and Near-shore Warming of the Colorado River Under Low Steady Flows Bill Vernieu Grand Canyon Monitoring & Research Center US Geological Survey Flagstaff, AZ
Mainstem Warming • Ho: Water temperatures in the mainstem will not increase downstream greater than temperatures previously observed under other flow conditions • Method: 11 sites from Glen Canyon Dam to Diamond Creek monitored as part of long-term GCMRC Integrated Water Quality Program
Near-Shore Warming • Ho: Near-shore temperatures in structurally complex habitats will not differ significantly from those observed in the mainstem • Method: Thermistor strings deployed perpendicularly from shore in various near-shore habitat types during July and August
Grand Canyon Warming Q (cfs) 20.00 150000 19.00 140000 18.00 130000 17.00 120000 16.00 110000 15.00 100000 D 14.00 90000 e 13.00 80000 g 12.00 70000 11.00 60000 C 10.00 50000 9.00 40000 8.00 30000 7.00 20000 6.00 10000 5.00 0 1992 1993 1994 1995 1996 1997 1998 1999 2000 2001 2002 STA GCQ R-15 R000 R061 R087 R226
Week beginning CRBD CRLF R226 Discharge (cfs) T T T T T 12JUN94 8.5 9.6 1.06 17.8 9.27 10631 18JUN95 9.1 9.3 0.20 14.6 5.51 16956 16JUN96 9.4 9.9 0.52 15.9 6.42 17189 15JUN97 8.6 9.0 0.44 13.5 4.88 26111 14JUN98 9.0 9.4 0.32 . . 18456 13JUN99 9.2 9.6 0.37 16.0 6.77 16599 18JUN00 9.5 10.4 0.93 19.5 10.03 8008
Mainstem WarmingConclusions • Instream warming of Glen Canyon dam releases increased significantly during low steady flow period • Highest temperatures observed in Grand Canyon in last decade and possibly since early 1970s • Strong inverse correlation of amount of warming with discharge level
5 m 0.5 m 1.0 m 2.0 m 3.0 m 5.0 m Near-Shore Thermistor Strings • 10 m • 1 m • 2 m • 3 m • 5 m • 10 m • 11 m • 15 m • 1 m • 3 m • 5 m • 10 m • 15 m • 25 m • 2 m • 5 m • 15 m • 25 m • 27 m
RM –9.5m 15m Thermistor String(Open Channel) m15 RM -9.5R deg C 19.5 18.5 17.5 16.5 15 10 15.5 5 3 1 14.5 1 2 3 5 13.5 12.5 11.5 10.5 9.5 16AUG00:12:00 16AUG00:18:00 17AUG00:00:00 17AUG00:06:00 17AUG00:12:00 17AUG00:18:00 CH 1m 3m 5m 15m 10m
m15 RM -9.5R deg C 19.5 18.5 17.5 16.5 15.5 14.5 13.5 12.5 11.5 10.5 9.5 16AUG00:12:00 16AUG00:18:00 17AUG00:00:00 17AUG00:06:00 17AUG00:12:00 17AUG00:18:00 CH 1m 3m 5m 10m 15m
RM 64.6L10m Thermistor String(Open Backwater) m10 RM 64.6L deg C 18.0 17.5 17.0 16.5 16.0 15.5 15.0 14.5 14.0 13.5 13.0 24JUL00:06:00 24JUL00:12:00 24JUL00:18:00 25JUL00:00:00 25JUL00:06:00 25JUL00:12:00 25JUL00:18:00 CH 1m 2m 3m 5m 10m river 1 2 3 5 10 10 5 3 2 1
m10 RM 64.6L deg C 18.0 17.5 17.0 16.5 16.0 15.5 15.0 14.5 14.0 13.5 13.0 24JUL00:06:00 24JUL00:12:00 24JUL00:18:00 25JUL00:00:00 25JUL00:06:00 25JUL00:12:00 25JUL00:18:00 CH 1m 2m 3m 5m 10m river
RM 64.6LThermal Infared Imagery7/25/00 location of 10m thermistor string shown <13.4 >19.1
Riffle RM 68 - Above Tanner Canyon Thermal infared image 7/25/00 20.4C Broad shallow area <13.5 >19.1 Backwater 18.5-20.7C
RM 87.4R 25m Thermistor String (Backwater) m25 RM 87.4R deg C 30 29 28 27 26 25 24 23 22 21 20 19 18 17 16 15 14 26JUL00:00:00 27JUL00:00:00 28JUL00:00:00 29JUL00:00:00 CH 2m 5m 15m 25m 27m 2m 5m 15m 25m 27m
m25 RM 87.4R deg C 30 29 28 27 26 25 24 23 22 21 20 19 18 17 16 15 14 26JUL00:00:00 27JUL00:00:00 28JUL00:00:00 29JUL00:00:00 CH 2m 5m 15m 25m 27m
Near-shore WarmingConclusions • Certain near-shore environments exhibited significant warming above mainstem temperatures • Warming highly dependent on incident solar radiation • Warming dependent on amount of isolation from main channel current • Most warming seen in shallow water (<1m) with little or no velocity • Larval fish or fry present at all locations where warming was observed
Final Conclusions • Timing and operational constraints of a proposed TCD limit temperature and amount of available warm water for consistent warm water release downstream • Consideration should be given to instream warming effects of lower flows to achieve desired temperatures at given target location downstream
Final Conclusions (cont’d) • Mainstem warming probably more a function of discharge level rather fluctuation • Near-shore warming probably more of a function of stable flows during daylight hours rather than discharge level • Main channel temperature sets baseline above which near-shore environments can warm