Download
1 / 15
160 likes | 473 Views
Graphing and Solving Quadratic Inequalities. Algebra 2 5.7. Learning Targets. Students should be able to… Graph quadratic inequalities in two variables Solve quadratic inequalities in one variable. Warm-up. Go over Quiz. Graphing Quadratic Inequalities.

E N D
Graphing and Solving Quadratic Inequalities Algebra 2 5.7
Learning Targets • Students should be able to… • Graph quadratic inequalities in two variables • Solve quadratic inequalities in one variable
Graphing Quadratic Inequalities • Graph the parabola – dash the line if the inequality is < or > • Shade above if > or ≥, shade below if < or ≤
Example 1 y > x2 – 2x – 3
Example 2 y < 2(x – 3)2
Example 3 y > x2 +2x – 4 y < -x2 + 3
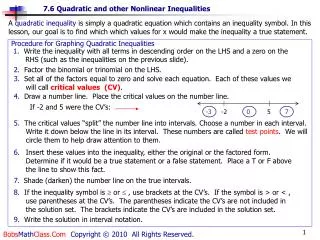
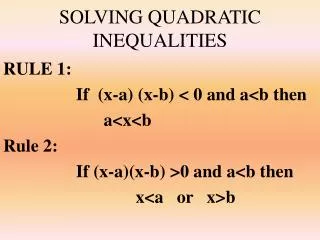
Solving Quadratic Inequalities If > or ≥ 0 then the solution is “or” write two separate inequalities If < or ≤ 0, then the solution is “and” write one compound inequality
Example 4 x2 + 3x – 18 > 0
Example 5 4x2 - 25 < 0
Example 6 3x2 + 11x ≤ 4
Homework Section 5.7 Page 303 – 304 • #14 – 16, 19 – 40 every 3, 43 – 46 all