Download
1 / 5
50 likes | 206 Views
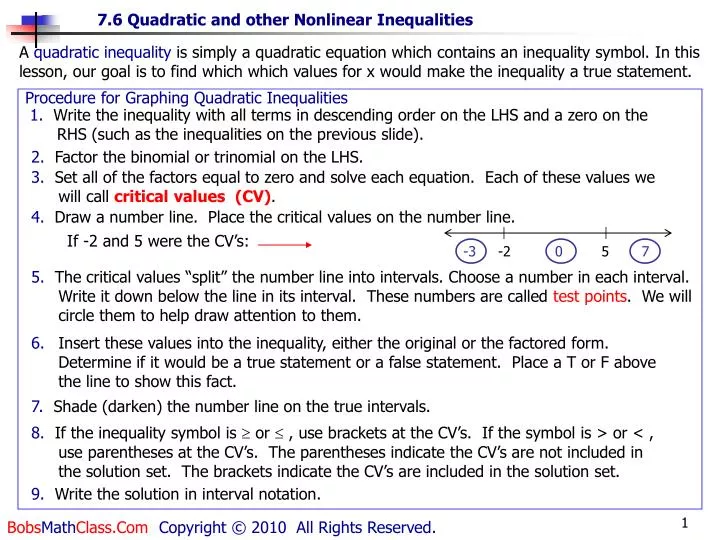
If -2 and 5 were the CV’s:. -3. 0. 7. -2. 5. A quadratic inequality is simply a quadratic equation which contains an inequality symbol. In this lesson, our goal is to find which which values for x would make the inequality a true statement. Procedure for Graphing Quadratic Inequalities.

E N D
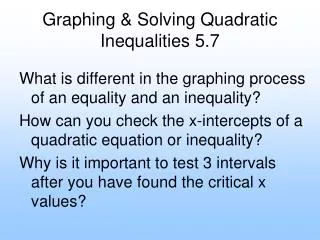
If -2 and 5 were the CV’s: -3 0 7 -2 5 A quadratic inequality is simply a quadratic equation which contains an inequality symbol. In this lesson, our goal is to find which which values for x would make the inequality a true statement. Procedure for Graphing Quadratic Inequalities 1. Write the inequality with all terms in descending order on the LHS and a zero on the RHS (such as the inequalities on the previous slide). 2. Factor the binomial or trinomial on the LHS. 3. Set all of the factors equal to zero and solve each equation. Each of these values we will call critical values (CV). 4. Draw a number line. Place the critical values on the number line. 5. The critical values “split” the number line into intervals. Choose a number in each interval. Write it down below the line in its interval. These numbers are called test points. We will circle them to help draw attention to them. 6. Insert these values into the inequality, either the original or the factored form. Determine if it would be a true statement or a false statement. Place a T or F above the line to show this fact. 7. Shade (darken) the number line on the true intervals. 8. If the inequality symbol is or , use brackets at the CV’s. If the symbol is > or < , use parentheses at the CV’s. The parentheses indicate the CV’s are not included in the solution set. The brackets indicate the CV’s are included in the solution set. 9. Write the solution in interval notation.
Then write the solution set in interval notation. Solution: T F T ] ) [ ( -6 8 -7 0 9 -2 15 T Your Turn Problem #1 F Then write the solution set in interval notation. Answer: T The trinomial is already in descending order and there is a zero on the RHS. We can then factor the LHS. Set each factor equal to zero to find the CV’s Place the CV’s on a number line. Choose a test point in each interval. Insert these values into the inequality. Determine if T or F. Darken the true intervals. Since we have the , use brackets. Finally, write the solution set in interval notation.
Graphing Rational Inequalities A rational inequality is simply a rational equation which contains an inequality symbol. Examples: , Our goal is still to find which which values for x would make the inequality a true statement. Procedure or Graphing Rational Inequalities 6. Write the solution in interval notation. Next Slide 1. Write the inequality with a zero on the RHS. In the examples above, there is already a zero on the RHS of the first example. In the second example, the 4 would have to be subtracted from both sides to get a zero on the RHS. 2. Set both numerator and denominator of the rational expression equal to zero to find the CV’s. 3. Perform the same steps similarly to graphing quadratic inequalities. i.e., pick test points, determine if T or F, and darken true intervals. 4. If > or < , use parentheses. If or , use brackets. Recall, the brackets are used to indicate the CV’s are included in our solution set. However, a rational expression can not have zero in the denominator. Therefore the CV which is obtained by setting the denominator equal to zero can never be included in the solution. So parentheses will always be used at the CV from the denominator.
Solution: CV’s F T F ) [ ( ] Darken the true intervals. -4 0 3 Since we have the , use brackets on the CV from the numerator and we always use parentheses on the CV from the denominator.. -3 5/2 Your Turn Problem #2 F F T Hint: Notice the pattern with the T’s and F’s. They alternate. “Most” of the problems you will encounter will either be TFT of FTF. If it doesn’t alternate, check your math. Then write the solution set in interval notation. Answer: -3/2 4 There is already a zero on the RHS. Set both numerator and denominator equal to zero to find the CV’s. Place the CV’s on a number line. Choose a test point in each interval. Insert these values into the inequality. Determine if T or F. Finally, write the solution set in interval notation.
Solution: T F T ( ] -4 0 3 -3 2 Your Turn Problem #3 ) ( Then write the solution set in interval notation. Answer: 2 4 Since there is not a zero on the RHS, this will be the first step. Subtract 3 from both sides. Place a 1 under the 3. Multiply both numerator and denominator by x–2 to combine fractions. Once we have zero on the RHS, we can perform the same steps just like the last example. Find CV’s. Insert test points to determine if T or F (work not shown). The End B.R 10-12-06