Download
1 / 14
140 likes | 156 Views
Measuring Development (2). Rich suburbs of London. Slums of India. Starter. In your groups, write down as many development indicators as you can. We are learning to…. Give reasons why combined indicators of development are more reliable than single indicators

E N D
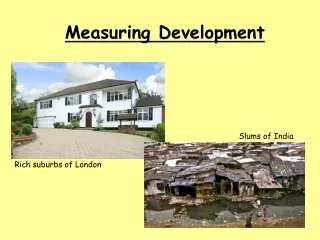
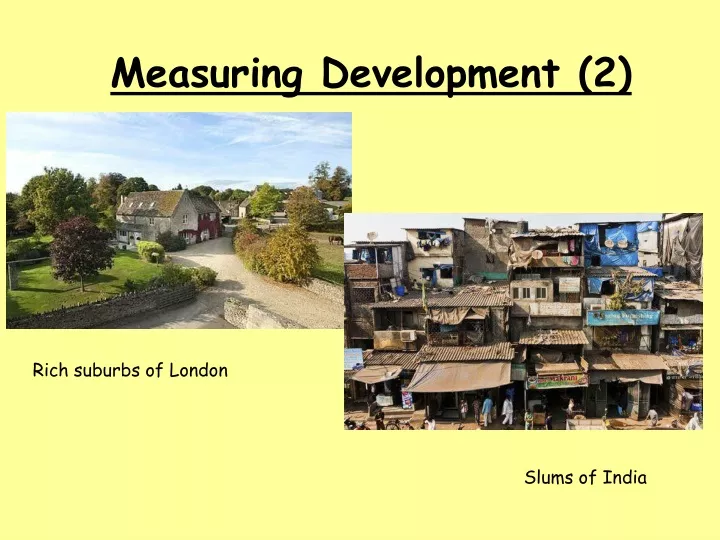
Measuring Development (2) Rich suburbs of London Slums of India
Starter In your groups, write down as many development indicators as you can
We are learning to… • Give reasons why combined indicators of development are more reliable than single indicators • Describe the Physical Quality of Life Index • Describe the Human Development Index
I Can… • Understand and explain the benefits of using combined indicators of development • Interpret and produce scatter graphs using various indicators of development
Comparing social and economic indicators Generally, countries that score highly on economic indicators also do well according to social indicators. This is because they can use their wealth to provide proper schooling, hospitals, food and decent housing. Countries with little wealth just cannot afford to provide all of these social services for their people.
Measuring Development Look at your hand out of the scatter graphs. Some countries appear more developed according to social indicators while others appear more developed according to economic indicators. Look at Fig. 8.1 and 8.2 Fig 8.1 shows that as a country’s income per person increases, so does the life expectancy of its people. But, some exceptions can be spotted: People in Mexico have a higher life expectancy than people in Estonia, but their average income is much lower. Any ideas why? Discuss with a partner for a minute.
Combined Indicators of Development As we have seen before, using just one indicator can be misleading. Often, a range of social and economic indicators are used. e.g. Above, China and India have been compared using five indicators. According to these, China is more developed than India
Alternatively, a range of indicators can be used to produce a single combined index. Two examples of these are: The Physical Quality of Life Index (PQLI) – this combines: • Life expectancy These produce an index from 0-100 • Infant mortality A PQLI of over 77 is considered • Adult literacy good. The higher the index, the better the quality of life of the country The Human Development Index (HDI) – this combines: • Life expectancy These produce an index from 0-1 • Adult literacy An HDI of 0.8 or above is • GNP/person considered developed • Cost of living • School enrolment
Task 1 Using an atlas, copy and complete the table above
Task two Answer the following questions: Why do countries that score highly on economic indicators usually also score highly on social indicators? Why is it more reliable to use several indicators? What factors make up the PQLI? If a country has a PQLI of 86, is it considered more or less developed than a country with a PQLI of 53? How many of the factors that make up the PQLI are a)social and b)economic What factors make up the HDI?
Task Three • Look at the hand out showing the scatter graphs. • What is the life expectancy and income per person in • Greece b) Nigeria c) Libya • 2. What is the % of people in agriculture and the number of calories per person in • a) Switzerland b) Brazil c) Sudan Draw a scatter graph to show the information in the table to the right
We were learning to… • Give reasons why combined indicators of development are more reliable than single indicators • Describe the Physical Quality of Life Index • Describe the Human Development Index
Can I… • Understand and explain the benefits of using combined indicators of development • Interpret and produce scatter graphs using various indicators of development