Download
1 / 25
260 likes | 432 Views
Measuring Development. Argument:. Over time, capitalist economic systems inevitably develop increasing inequality within a population because factors of production such as capital, land, and entrepreneurship become concentrated in the hands of the wealthy.

E N D
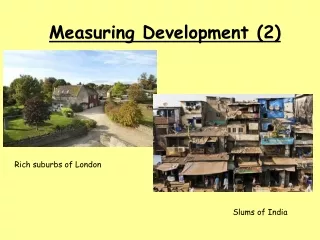
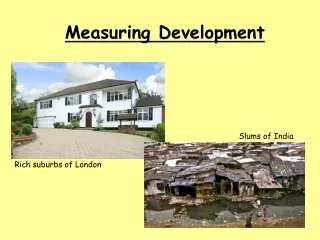
Argument: Over time, capitalist economic systems inevitably develop increasing inequality within a population because factors of production such as capital, land, and entrepreneurship become concentrated in the hands of the wealthy.
Does GDP per capita give a reasonable estimate of the welfare of a nation’s population?
Measuring inequality: The Lorenz Curve The further the Lorenz Curve is from midpoint line, the more inequality that exists http://content.answers.com/main/content/img/oxford/Oxford_Geography/0198606737.lorenz-curve.1.jpg
Gini Index • Higher Gini Index # = Higher Inequality
Gini Coefficient Gini Coefficient = A/(A + B) • Range 0-1 If A is small because there is little inequality in the country, the coefficient will be close to zero. Real World Approximate Range 0.25 (Denmark) to 0.70 (Namibia)
Gini Index Gini Index =Gini Coefficient [A/(A + B)] x 100 • Range 0-100 Namibia 70.7 South Africa 65 Philippines 45.8 United States 45 Japan 38.1 India 36.8 South Korea 31.3 Sweden 25
Choose two countries below, draw a Lorenz Curve for each on the same graph to compare inequality among their citizens, and use it to explain (in a brief paragraph) whether income inequality tends to be a bigger issue among MEDCs or LEDCs. • 1Namibia70.7 • 2South Africa65.0 • 3Lesotho63.2 • 4Botswana63.0 • 5Sierra Leone62.9 • 6Central African Republic61.3 • 7Haiti59.2 • 8Colombia58.5 • 9Bolivia58.2 • 10Brazil56.7 • 11Guatemala55.1 • 12Honduras53.8 • 13Hong Kong53.3 • 14Paraguay53.2 • 15El Salvador52.4 • 16Chile52.4 • 17Panama51.0 • 18Papua New Guinea50.9 • 19Zambia50.8 • 20Niger50.5 • 21Swaziland50.4 • 22Gambia, The50.2 • 23Zimbabwe50.1 • 24Dominican Republic49.9 • 25Peru49.6 • 26Sri Lanka49.0 • 27Mexico48.2 • 28Costa Rica48.0 • 29Singapore47.8 • 30Madagascar47.5 • 31Mozambique47.3 • 32Nepal47.2 • 33Uruguay47.1 • 34Ecuador46.9 • 35Rwanda46.8 • 36Philippines45.8 • 37Uganda45.7 • 38Jamaica45.5 • 39United States45.0 • 40Cameroon44.6
Does foreign direct investment by multinational corporations (MNCs) improve the welfare of the citizens of developing countries or does it lead to increased inequality among citizens?
Does investment by MNCs appears to be benefitting the typical citizen in each country? Developing Countries • Brazil 56.7 • China 41.5 • Mexico 48.2 • Thailand 43 • Malaysia 44.1 • India 36.8
How should we define development given the fact that our definition will guide economic policy?
Economic Growth vs Development Development: Where increases in real GDP per capita are accompanied by increases in standards of living Increases in welfare Increases in human freedom Economic Development Growth
If we don’t know what development is, how do we measure it? 2000 UN Millenium Development Goals
HDIHuman Development Index Composite Index: • Health Life Span • EducationLiteracy + School enrolment • GDP/capita
Anomalies • Saudi Arabia- 44th GDP/capita, 77th HDI
South Africa • 52nd GDP/capita, 120th HDI
Ecuador • 112th GDP/capita, 82nd HDI
Sweden • 20th GDP/capita, 6th HDI
Zimbabwe • 125th GDP/capita, 145th HDI
Gender MeasurementsUN Millenium Goals Goal 3: Promote gender equality and empower women Target 4: Eliminate gender disparity in primary and secondary education, preferably by 2005, and in all levels of education not later than 2015 Ways of Measuring: -Ratio of girls to boys in primary, secondary and tertiary education -Ratio of literate women to men, 15–24 years old -Share of women in wage employment in the non-agricultural sector -Proportion of seats held by women in national parliament
Gender Measurements Gender-related Development Index (GDI) • GDI = HDI adjusted for inequality between men and women • If GDI is lower than HDI, more inequality Gender Empowerment measure (GEM) • % of women in leadership, management, and parliament positions • Share of national income
HPIHuman Poverty Index Proportion of people not meeting a basic level of each of the HDI goals: % who do not reach age 40 % of adults who are illiterate % of pop without access to safe water + % of kids who are underweight • Human Poverty Index Map
GPI Genuine Progress Indicator Website explaining GPI
Review • What is development? • How is development measured?