Download
1 / 21
210 likes | 218 Views
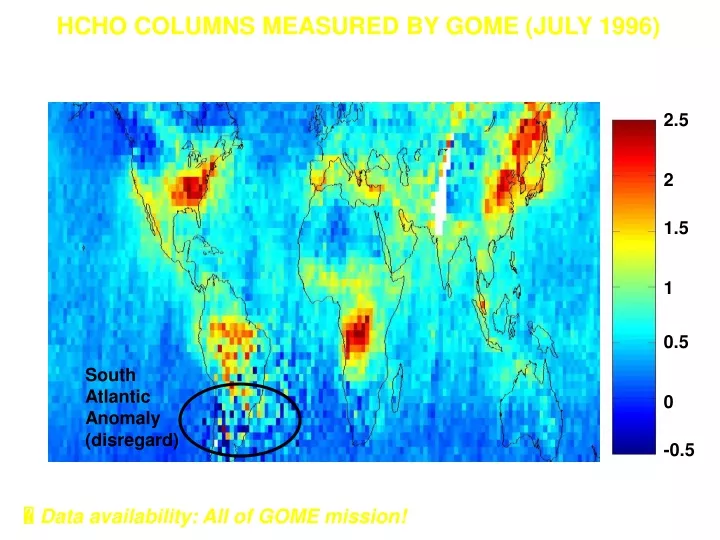
2.5. 2. 1.5. 1. 0.5. 0. -0.5. HCHO COLUMNS MEASURED BY GOME (JULY 1996). Units of 10 16 molecules cm -2 Uncertainty ~1x10 16 molecules cm -2 (~2 ppbv in 2 km boundary layer). South Atlantic Anomaly (disregard).

E N D
2.5 2 1.5 1 0.5 0 -0.5 HCHO COLUMNS MEASURED BY GOME (JULY 1996) Units of 1016 molecules cm-2 Uncertainty ~1x10¹⁶ molecules cm-2 (~2 ppbv in 2 km boundary layer) South Atlantic Anomaly (disregard) High HCHO regions reflect VOC emissions from fires, biosphere, human activity Data availability: All of GOME mission!
OZARKS “ISOPRENE VOLCANO” AS SEEN BY GOME Temperature dependence of isoprene emission (GEIA) GOME HCHO columns over the Ozarks, July 1996: daily orbits and relationship to temperature
SEASONALITY OF GOME HCHO COLUMNS (1997)Largely reflects seasonality of isoprene emissions;general consistency with GEIA but also some notable differences GOME GEOS-CHEM (GEIA) GOME GEOS-CHEM (GEIA) MAR JUL APR AUG SEP MAY JUN OCT
Preliminary SCIAMACHY HCHO Four orbits in June, 2004
Preliminary SCIAMACHY HCHO Four orbits in June, 2004, 43 binning
Preliminary SCIA / in situ comparison Chris Sioris Smithsonian Astrophysical Observatory Randall Martin Dalhousie University
Total NO2 VCD (geometric AMF), strat VCD=~3e15 molec/cm2, 0.5x0.5 regridding Orbits coincident with DC-8 during INTEX-NA (July1-25th)
July 1st Tropopause at 11 km Trop columns < 11 km by nadir-limb subtraction
July 6th • NO2 from lightning ? • Cloud and rain over Southwest Iowa (e.g. Fort Madison) between 9:30 and 10:30, then clear by 10:55 (wunderground.com) TOMS: 11:16 am Eq. X-ing LT
SCIAMACHY near-IR observations at ~39 N, ~89 W Cloud top at 13.5 km +/- 1.3 km, i.e. almost to tropopause
Hagerstown, MD (pop’n: 37 000) ← (http://www.creativemethods.com/airquality/sources/)
July 12th Twin cities New Orleans Houston
July 18th • [Highest column: Paraguay (orbit 12460)]
July 20th Toronto New Haven
July 22nd • forgotten
July 25th Twin cities Chicago ARKANSAS
Conclusions • Clouds: major problem • Limb pointing: very minor problem • Spatial variability: major problem