Download
1 / 6
60 likes | 230 Views
jmaplot: making Postscript plots with IDL Jesús Maíz-Apellániz STScI, 24 March 2004. What is IDL?.

E N D
jmaplot:making Postscript plots with IDLJesús Maíz-ApellánizSTScI, 24 March 2004
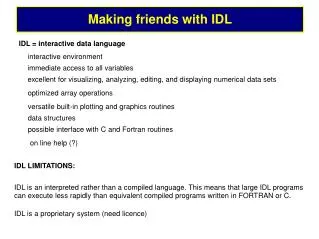
What is IDL? IDL, the Interactive Data Language, is an easy-to-learn, cross-platform application that enables in-depth data analysis through industry-leading visualization. IDL’s interactive, high-level language is the ideal solution for analysts, scientists, engineers or anyone who needs to make discoveries, diagnoses and decisions based on data. http://www.rsinc.com
What is IDL? • Fortran-like programming language • Interpreted, not compiled • Very useful high-level functions • Advanced mathematical libraries • Many procedures available on the web • Astronomical libraries also available • Extensive graphical capabilities Ideal for making almost any kind of plot
How do I make a plot in IDL? shell> idl IDL> x = [0,1,2,3,4,5] IDL> y = [1,3,2,4,3,6] IDL> plot, x, y IDL> iplot, x, y IDL> singleplot, ‘test.ps’, [[x],[y]]
Description of jmaplot • singleplot: workhorse • Line plots • Symbol plots, histograms, error plots, text as a function of x-y… • Image display • Any combination of the above • singlecontour: contour plots • multigraph: wrapper for multiple plots
How do I install/learn jmaplot? • Download jmaplot.tar.gz from: http://www.stsci.edu/~jmaiz • Unpack the tar.gz file and make the directory visible from IDL, e.g. in your .cshrc file add: • setenv IDL_PATH ${IDL_PATH}:my_path • Follow the tutorial in the web page • Use the online help at: http://www.stsci.edu/~jmaiz/jmaplot/index_alt.html