Download
1 / 26
290 likes | 804 Views
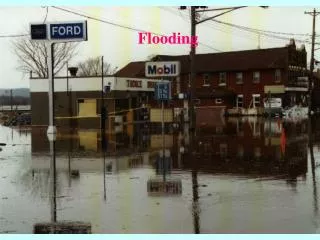
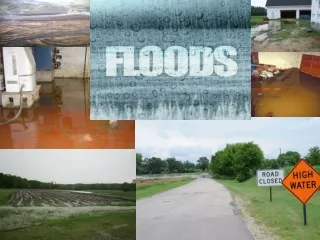
Flooding. Causes & Effects. In England, the most common forms of floods are : • River flooding that occurs when a watercourse cannot cope with the water draining into it from the surrounding land. This can happen, for example, when heavy rain falls on an already waterlogged catchment .

E N D
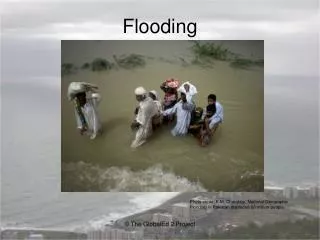
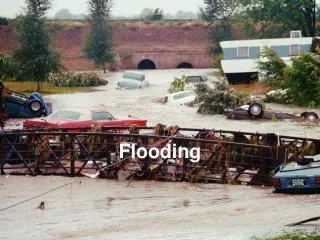
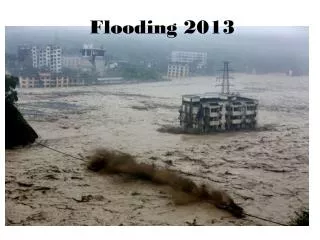
Flooding Causes & Effects
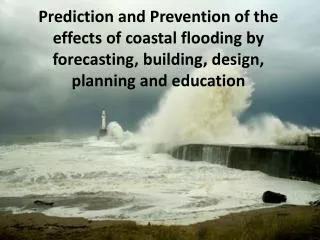
In England, the most common forms of floods are: • River flooding that occurs when a watercourse cannot cope with the water draining into it from the surrounding land. This can happen, for example, when heavy rain falls on an already waterlogged catchment. • Coastal flooding that results from a combination of high tides and stormy conditions. If low atmospheric pressure coincides with a high tide, a tidal surge may happen which can cause serious flooding. • Surface water flooding which occurs when heavy rainfall overwhelms the drainage capacity of the local area. It is difficult to predict and pinpoint, much more so than river or coastal flooding. • Sewer flooding that occurs when sewers are overwhelmed by heavy rainfall or when they become blocked. The likelihood of flooding depends on the capacity of the local sewerage system. Land and property can be flooded with water contaminated with raw sewage as a result. Rivers can also become polluted by sewer overflows. • Groundwater flooding that occurs when water levels in the ground rise above surface levels. It is most likely to occur in areas underlain by permeable rocks, called aquifers. These can be extensive, regional aquifers, such as chalk or sandstone, or may be more local sand or river gravels in valley bottoms underlain by less permeable rocks.
Additional causes of flooding: Failure of a dam Breach of dykes and levees Tsunami waves Earthquake lowering of land level
Source EA: Flooding in England, a national assessment of flood risk 2009
Environment Agency 2008 National Flood Risk Assessment 2.4 million properties at risk of flooding from rivers and the sea in England. 1 million properties also at surface water flood risk 2.8 million properties susceptible to surface water flooding alone In all, around 5.2 million properties in England, or one in six are at risk of flooding. The expected annual damages to residential and non-residential properties in England at risk of flooding from rivers and the sea is estimated at more than £1 billion.
River flooding • Precipitation on the catchment exceeds drainage capacity. • Extreme rainfall • Narrowing of channel, obstructions, sedimentation • Previously dry weather hardens soil • Peat cutting • Deforestation • Paving over gardens • Flash flooding effect
Coastal flooding • Storm surges due to low barometric pressure ‘humping up’ the sea and wind blown seas • High Spring tides • estuarine narrowing, tidal bores • Rising sea levels (global warming) (expected 1m /100 years) • Ice melting • Thermal expansion • Isostatic rebound (SE England sinks at 30cm/100years)
Surface Water Flooding • Combination of factors exceeds local drainage capacity. • Infiltration reduced by dry, covered ground • Confluence effects • Sewage and drainage system overwhelmed • Urbanisation
Glaciers and ice caps Each year about 8 mm of ocean water falls on the Antarctica and Greenland ice sheets as snowfall. If no ice returned to the oceans, sea level would drop 8 mm every year. To a first approximation, the same amount of water appeared to return to the ocean in icebergs and from ice melting at the edges. There is also evidence of antarctic ice shelves breaking up and accelerating movement of the Greenland ice cap (BBC ‘Frozen Planet’ documentary series no7 - 2011) High-precision gravimetry from satellites in low-noise flight determined that Greenland was losing more than 200 billion tons of ice per year, in accord with loss estimates from ground measurement. The rate of ice loss was accelerating, having grown from 137 gigatons in 2002–2003. In 1992, satellites began recording the change in sea level;they display an acceleration in the rate of sea level change, but they have not been operating for long enough to work out whether this signals a permanent rate change, or an artifact of short-term variation. Source: Wikipedia
Sea level rise – flood maps Sea level measurements from 23 long tide gauge records in geologically stable environments show a rise of around 200 millimetres (8 inches) per century, or 2 mm/year. Source: Wikipedia
Humberside 1m sea level rise Source: flood.firetree.net
Flood maps Humberside: 2m sea level rise Source: flood.firetree.net
Humberside 3m sea level rise Source: flood.firetree.net
In the summer of 2007 “extreme levels of rainfall” caused pluvial flooding which affected many areas of the UK (Pitt, 2008). In Hull, over 20 000 people were affected, 6 300 of whom were forced to leave their homes and live in temporary accommodation (Coulthardet al., 2007). Despite this, pluvial flooding is not currently considered to be a contingent hazard and is therefore not planned for in the same way as fluvial or coastal flooding. The floods of the summer 2007 in Hull revealed a certain amount of ambiguity surrounding the responsibility of the institutions involved in flood governance. This study will attempt to map and analyse the complex governance arrangements surrounding flood risk in the north Humber area and critically examine the interaction of government-led and community-led initiatives to reduce flood risk in the area. Source: http://www2.hull.ac.uk/science/geography/staff/research_students/rogers-wright.aspx
Source: Humber Flood Risk Management Strategy – Environment Agency 2008
References • National flood and coastal erosion risk management strategy for England EA/Defra June 2011 • Facing up to Rising Sea Levels RIBA/ICE • Hull Flood 2007 – interim report (Independent Review Body) 24/8/2007 • Humber Flood Risk Management Strategy EA Mar 2008 • Govt. Response to Pitt Report Defra Dec 2009 • London Strategic Flood Framework (Version 1) London Resilience Team Jan 2010 • Flooding in England – A National Assessment of Flood risk EA 2009 • Environmental Aspects of Integrated Flood Management WMO Geneva 2006 • The Risk of Tidal flooding in London T J Marsh 2004 • River Systems & Causes of Flooding Prof S Nelson Tulane Uni. Nov 2011 • http://www.floodprobe.eu • The Alkborough Tidal Defence Scheme EA