Download
1 / 11
110 likes | 182 Views
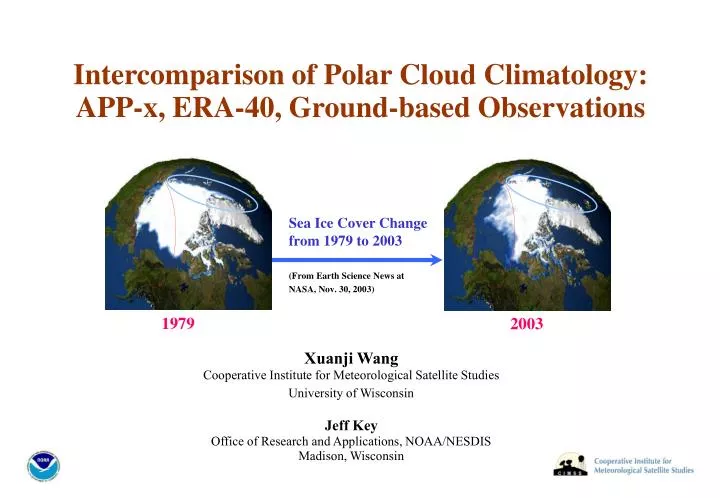
1979. Intercomparison of Polar Cloud Climatology: APP-x, ERA-40, Ground-based Observations. Sea Ice Cover Change from 1979 to 2003. (From Earth Science News at NASA, Nov. 30, 2003). 2003. Xuanji Wang Cooperative Institute for Meteorological Satellite Studies University of Wisconsin

E N D
1979 Intercomparison of Polar Cloud Climatology: APP-x, ERA-40, Ground-based Observations Sea Ice Cover Change from 1979 to 2003 (From Earth Science News at NASA, Nov. 30, 2003) 2003 Xuanji WangCooperative Institute for Meteorological Satellite StudiesUniversity of Wisconsin Jeff KeyOffice of Research and Applications, NOAA/NESDISMadison, Wisconsin
APP-x Dataset: • Extended AVHRR Polar Pathfinder (APP-x) Dataset • Time period: 0400 & 1400 Local Solar Time (LST) for the period of 1982 - 2004. • Spatial resolution: 25 x 25 km2 on EASE-grid.
APP-x vs SHEBA : Cloudiness • Surface Heat Budget of the Arctic Ocean (SHEBA) • Time period: Oct. 1997 – Oct. 1998, monthly mean; Spatial resolution: SEHBA ship observation. • Comparison was made on 14:00 LST at SHEBA ship site, APP-x box size is 25x25 km2 ( 5km spatial resolution APP-x data was used.) MONTH APP-x SHEBA BIAS(A-S) RMSS 1 0.6152 0.3802 0.2350 0.2835 2 0.7280 0.5509 0.1771 0.3022 3 0.8372 0.5907 0.2466 0.3643 4 0.8029 0.6991 0.1037 0.2034 5 0.8209 0.7997 0.0212 0.0880 6 0.6892 0.7460 -0.0568 0.1908 7 0.8895 0.8445 0.0451 0.1931 8 1.0000 0.8960 0.1040 0.1040 10 0.1667 0.1250 0.0417 0.0417 11 0.6640 0.6750 -0.0110 0.3324 12 0.5787 0.2124 0.3663 0.3677 ---------------------------------------------------------------- Average 0.7291 0.5970 0.1322 0.2637
APP-x vs Surface : Cloudiness • Surface-based Observations by Hahn (1995) • Time period: monthly mean over 1982-1991; Spatial resolution: Arctic area north of 80oN. • Comparison was made on the monthly mean basis, APP-x was averaged for 14:00 LST ( 25km spatial resolution APP-x dataset was used.)
APP-x vs ERA-40 : Cloudiness • ECMWF 40 Year Re-analysis (ERA-40) Dataset • Time period: mid-1957 to mid-2002, four times per day; Spatial resolution: 2.5ox 2.5o grid. • Comparison was made on the hourly and monthly mean basis, APP-x was averaged for box size of 225 km x 225 km with 14:00 and 04:00 datasets ( 25km spatial resolution APP-x dataset was used.) MONTH(NO) APP-x | ERA-40 | Bias (A-E) ------------------------------------------------------------ 1(61) 0.47 0.63 -0.16 2(56) 0.46 0.75 -0.29 3(62) 0.30 0.53 -0.24 4(59) 0.56 0.82 -0.27 5(62) 0.60 0.60 0.00 6(59) 0.57 0.72 -0.15 7(62) 0.72 0.80 -0.08 8(62) 0.70 0.75 -0.05 9(60) 0.75 0.75 0.00 10(60) 0.66 0.70 -0.04 11(60) 0.59 0.71 -0.12 12(62) 0.57 0.64 -0.07 ------------------------------------------------------- (730) 0.58 0.70 -0.12
ERA-40 APP-x Diurnal cycles of cloudiness at Kougarok site, Alaska from APP-x (black cross) and ERA-40 (blue curve) for January, April, July, and October, 1999.
14:00 LST ERA-40 vs APP-x : Cloudiness = - ERA-40 at 14:00 LST for January, 1999 APP-x at 14:00 LST for January, 1999 ERA-40 minus APP-x at 14:00 LST for January, 1999 = - ERA-40 at 14:00 LST for July, 1999 APP-x at 14:00 LST for July, 1999 ERA-40 minus APP-x at 14:00 LST for January, 1999
04:00 LST ERA-40 vs APP-x : Cloudiness = - ERA-40 at 04:00 LST for January, 1999 APP-x at 04:00 LST for January, 1999 ERA-40 minus APP-x at 04:00 LST for January, 1999 = - ERA-40 minus APP-x at 04:00 LST for January, 1999 ERA-40 at 04:00 LST for July, 1999 APP-x at 04:00 LST for July, 1999
Trends in the Arctic Cloudiness from APP-x, North of 60oN, 14:00 LST All Surface Types All Landmasses All Ocean Parts
Trends in cloudiness from APP-x for winter, spring, summer, and autumn. 14:00 LST MAM DJF JJA SON
Summary • Satellites tend to overestimate cloudiness in comparison to the ground-based naked eye observation during the Arctic darkness, and underestimate cloudiness during the Arctic brightness to less extent than the Arctic darkness. • ERA-40 tends to overestimate cloudiness in comparison to APP-x for the high-latitude area, i.e., north of 60oN, and underestimate cloudiness for the lower-latitude area, i.e., south of 60oN. • Arctic cloudiness has generally decreased or not changed in winter and at night, but increased during the day in spring. Overall, an annual weak decreasing trend in cloudiness over 1982-2004 was found. But if the data of 2001-2004 was excluded from the analysis, there would be no annual trend in Arctic cloudiness. There is a suspect that calibration of NOAA-16 is problematic, especially for AVHRR visible channels, though it was solved more or less in standard APP dataset. • Trends in cloudiness for different surface types of the Arctic area north of 60oN are consistent.