Download
1 / 30
340 likes | 1.09k Views
Kill Curve Analysis. Hartmut Derendorf, PhD University of Florida. Drug Delivery Pharmacokinetics Pharmacodynamics. ?. Biopharmaceutics. ?. PK-PD-Modeling. Biomarker vs. Surrogate Endpoint. Biomarker

E N D
Kill Curve Analysis Hartmut Derendorf, PhD University of Florida
Drug Delivery Pharmacokinetics Pharmacodynamics ? Biopharmaceutics ? PK-PD-Modeling
Biomarker vs. Surrogate Endpoint Biomarker Drug- or disease-induced measurable physiological, pathophysiological or biochemical change Surrogate Endpoint Biomarker that has predictive value for therapeutic outcome
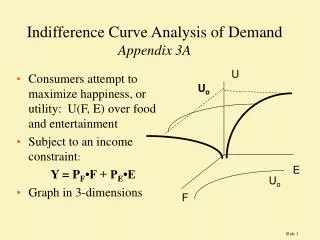
E = intensity of effect Emax = maximum effect C = concentration EC50 = concentration at 0.5 Emax Emax - model
Emax - model EC50
ln EC50 - 2 Emax - model
E = intensity of effect Emax = maximum effect C = concentration EC50 = concentration at 0.5 Emax n = shape (slope) factor Sigmoid Emax - model
Sigmoid Emax - model normal plot semilogarithmic plot
Pharmacodynamics of Anti-infective Agents • in vitro studies • steady state • dilution models • diffusion models • animal studies • clinical studies
Noncompartmental PK-PD Models • Time above MIC • Cmax/MIC • AUC24/MIC • Area under the inhibitory curve (AUIC) • - based on reciprocal serum inhibitory titers • - calculated as AUC24/MIC for C>MIC • AUC above MIC
16 • Time above MIC • Cmax/MIC • AUC24/MIC • AUIC • AUC above MIC Cmax AUC > MIC 12 8 Concentration (µg/mL) MIC 4 0 24 12 0 6 18 Time (hours) t > MIC
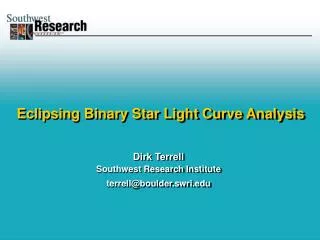
Ceftazidime K. pneumoniae in neutropenic mice Craig 2002
Temafloxacin S. pneumoniae in neutropenic mice Craig 2002
Pharmacodynamics conc. vs effect Pharmacokinetics conc. vs time 0.4 Conc. Effect 0.0 Time 0 25 Conc. (log) 10 -3 PK/PD effect vs time 1 Effect 0 Time 0
Concentration-dependent vs. Time-dependent Craig 1991
Kill Curves flask reservoir tubing connector pump waste Auto-dilution system
PK-PD Model Maximum Growth Rate Constant k Maximum Killing Rate Constant k-kmax Initially, bacteria are in log growth phase
PK-PD Model In animals Bacterial survival fraction of P. aeruginosa in a neutropenic mouse model at different doses (mg/kg) of piperacillin (Zhi et al., 1988)
Single Dose Piperacillin vs. E. coli
Dosing Interval Piperacillin (2g and 4g) vs. E. coli q24h q8h q4h
FDA Draft-Guidance for Industry (1997) Providing Clinical Evidence of Effectiveness for Human Drug and Biological Products New Dosage Form of a Previously Studied Drug In some cases, modified release dosage forms may be approved on the basis of pharmacokinetic data linking the new dosage form from a previously studied immediate-release dosage form. Because the pharmacokinetic patterns of controlled-release and immediate release dosage forms are not identical, it is generally important to have some understanding of the relationship of blood concentration to response to extrapolate to the new dosage form.
500 mg IR Plasma and free tissue levels n = 12 (means +/- S.D.) total plasma concentrations free tissue concentrations
Plasma and free tissue levels 500 mg MR 750 mg MR n = 12 (means +/- S.D.) total plasma concentrations free tissue concentrations
Conclusion Microdialysis has opened the door to get better information about the drug concentrations at the site of action. This, in combination with appropriate PK/PD-models, will allow for better dosing decisions than traditional approaches based on blood concentrations and MIC.
PK/PD in Drug Development Streamlining Rational Approach Cost Saving Time Saving
Questions • What are some of the limitations of MICs? • What is the difference between AUC/MIC vs. AUIC? • Should one use total or unbound concentrations to calculate PK/PD-indices? • Why do peak concentrations correlate with aminoglycoside activity but not with beta-lactam activity? • Is AUC/MIC a reasonable PK/PD-index for a macrolide?