Download
1 / 17
220 likes | 556 Views
Overfitting and Its Avoidance. Chapter 5. Overfitting. 即「 過適 」、「 超適 」或稱「 過度擬 合 」 意 指在調適一 個 model 時 ,使用 過多 參數 。 對比於可取得的資料總量來說,一個荒謬 的 model 只要 足夠複雜 ,是可以 完美地 適應 (fit) 資料。 不合乎 一般化 (Generalization) 違反 奧卡姆 剃刀 ( O cca m ’ s Razor ) 原則. Overfitting & Generalization. A extreme example –

E N D
Overfitting and Its Avoidance Chapter 5
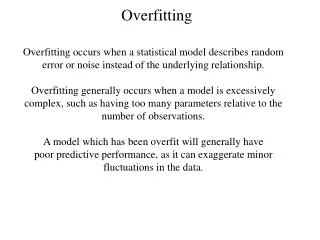
Overfitting • 即「過適」、「超適」或稱「過度擬合」 • 意指在調適一個model時,使用過多參數。對比於可取得的資料總量來說,一個荒謬的model只要足夠複雜,是可以完美地適應(fit)資料。 • 不合乎一般化 (Generalization) • 違反奧卡姆剃刀(Occam’s Razor)原則
Overfitting &Generalization • Aextreme example – • Customer churn or non-churn • Training data & Holdout data
Overfitting Examined • Holdout Data and Fitting Graphs- A fitting graph shows the accuracy of a model as a function of complexity . Figure 1. A typical fitting graph.
Overfitting Examined • Base rate- • What would b be ? Figure 2. A fitting graph for the customer churn (table) model.
Overfitting in Tree Induction • Decision tree induction • overfitting starts to • the “sweet spot” in the graph . Figure 3. A typical fitting graph for tree induction.
Overfitting in Mathematical Functions • We add more Xi, the function becomes more and more complicated. • Each Xi has a corresponding Wi, which is a learned parameter of the model . • Two dimensions you can fit a line to any two points and in three dimensions you can fit a plane to any three points . • This concept generalizes: as you increase the dimensionality, you can perfectly fit larger and larger sets of arbitrary points .
Example: Overfitting Linear Functions Data:sepal width, petal width Types:Iris Setosa, Iris Versicolor Two different separation lines: Logistic regression Support vector machine Figure 4
Example: Overfitting Linear Functions Figure 4 Figure 5
Example: Overfitting Linear Functions Figure 6 Figure 7
From Holdout Evaluation to Cross-Validation Holdout EvaluationSplits the data into only one training and one holdout set. Cross-validationcomputes its estimates over all the data by performing multiple splits and systematically swapping out samples for testing. ( k folds, typically k would be 5 or 10. )
The Churn Dataset Revisited “Example: Addressing the Churn Problem with Tree Induction” in Chapter 3. • The logistic regression models show slightly lower average accuracy (64.1%) and with higher variation ( standard deviation of 1.3) • Average accuracy of the folds with classification trees is 68.6%—significantly lower than our previous measurement of 73%.( the standard deviation of the fold accuracies is 1.1 ) • Classification trees may be preferable to logistic regression because of their greater stability and performance.
Learning Curves • The generalization performance of data-driven modeling generally improves as more training data become available.
Overfitting Avoidance & Complexity Control Concept in Tree Induction : • Tree induction commonly uses two techniques to avoid overfitting. These strategies are : • (i) to stop growing the tree before it gets too complex, and • (ii) to grow the tree until it is too large, then “prune” it back, reducing its size (and thereby its complexity). Methods in Tree Induction : • To limit tree size is to specify a minimum number of instances that must be present in a leaf. • Hypothesis test ( P-value )
Overfitting Avoidance & Complexity Control General Method for Avoiding Overfitting • Compare the best model we can build from one family (say, classification trees) against the best model from another family (say, logistic regression). • Nested holdout testing • Select the best model by assess by having a complexity of 122 nodes ( the sweet spot). • Induce a new tree with 122 nodes from the whole, original training data. Training subset Training set Validation set Final hold out Test set ( hold out )
Overfitting Avoidance & Complexity Control • Nested Cross-Validation • Sequential Forward Selection Training set Test set Original data