Download
1 / 54
560 likes | 762 Views
Remote Monitoring (RMON). Network Manglement. Outline. general introduction overview rmon 1 and 2 groups control theory rmon 1 groups (some) conclusion/summary. RMON – means what. remote monitoring aggregate stats for a network aggregate stats for a host for host X talking to host Y

E N D
Remote Monitoring (RMON) Network Manglement
Outline • general introduction • overview • rmon 1 and 2 groups • control theory • rmon 1 groups (some) • conclusion/summary
RMON – means what • remote monitoring • aggregate stats for a network • aggregate stats for a host • for host X talking to host Y • layer 1 and layer 2 • and more • question: do we have the right information? • related question: how are networks evolving? • one more question: is SNMP the right approach?
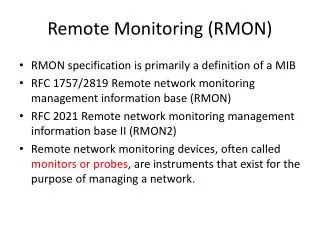
bibliography • rfc1513, 1993 - token-ring extensions • rfc1757, 1995, MIB 1 • rfc2021, 1997, MIB 2 • rfc2074, 1997, protocol identifiers (directory) • David Perkin’s RMON book • SNMP, v2, v3, RMON1/2, Stallings
rmon and OID tree iso(1) directory(1) X.500 mgmt(2) org(3) mib-2(1) dod(6) system(1) ... internet(1) rmon(16) rmon1 & 2
rmon intro • rmon - remote monitoring • rmon I - stats at ethernet layer (MAC addresses, but not upstairs) • rmon II - stats at network and transport layers (IP addresses and tcp/udp ports)
network analysis picture (trad) analyzer: in promiscous mode router (or switch) A B analyzer: can hear A,B, to/from router traffic on traditional 10BASE shared link
manager/probe manager sends get database item (OID) probe sends response MIBS (sampled data) probe
basic idea/s: • all kinds of stats - but gathered on per link basis as aggregate • not by manager from every host on link • ethernet focus (token-ring support too) • rmon probe can run SOMEWHAT by itself and gather information • however manager needed for more complex functions (may have to suck out data on periodic basis due to lack of space)
rmon 1 functions - overview • sample stats for all devices on ethernet link • ethernet level - e.g., how many collisions • basic and history • derived statistics • for each host • top N talkers (who sent most bytes?) • matrix of conversations SRC x RCV
rmon 1, cont • threshold events • look for N events in elapsed time T • if found, send trap to manager • e.g., N errors in one minute (too many) • packet data capture • filtering mechanism + capture • must work with higher level GUI in manager • goal: capture packets of interest/nice decode display
rmon 1 - { mib-2 16 } • statistics(1) - ethernet stats > interface, roughly equal to dot3 (but global) • history(2) - snapshots based on stats(1) • alarm(3) - ability to set threshold, generate alarm on interesting event • host(4) - per i/f host stats (global interface) • hostTopN(5) - store/sort by top N hosts • matrix(6) - X talks to Y ( a few stats )
rmon 1, cont. • filter(7) - filter pkts and capture/or cause event • capture(8) - traditional packet analyzer • event(9) - table of events generated by probe • tokenRing(10) - never mind, but like ethernet stats
rmon2, still { mib-2 16} • protocolDir(11) - protocols understood by probe • protocolDist(12) - per protocol stats (bytes/pktcnt) • addressMap(13) - ip/mac mappings • nlHost(14) - per host octet/byte counts • nlMatrix(15) - host X talks to host Y • alHost(16) - per host application octet/byte counts • alMatrix(17) - application Z/X to Z/Y • usrHistory(18) - sampling of any INT OID • probeConfig(19) - info for manager on probe setup/config
rmon2: notes • application means “above the network layer” • both matrix groups have top N functions as well • note both protocol directory and probe configuration are there to help odds on manager/probe interoperability
do we need a manager? • mostly ... • simpler stats in rmon1 could be gathered via net-snmp say but • higher level functions require complex manager with better than average GUI • rmon-2 in general (you want graphical histograms) • packet capture facilities in probe are lower-level and need higher level manager sw function
examples: • commercial (just one example, others exist) • cisco traffic director on workstation (manager) • cisco netscout probe on link • cisco mini-rmon in some switches • freeware versions ?! • BTNG (it’s dead Jim) • there aren’t any. is this a surprise? • ourmon …(not SNMP-based)
software complexity notes: • higher-level functions (e.g., rmon2 or rmon1 data packet capture) • require copious memory/CPU • 100mbit ethernet link ... lots of data • easy to ask too much of system • probably best to not assume that manager A will interoperate with probe B
possible rmon uses • what kind of questions might you ask? • how much IP vs IPX traffic? • how much traffic is web/news/ftp, whatever? • how utilized (full) is the pipe? • who talks to server X? • we have a problem with DHCP, we need to capture the packets and look? • global ethernet errors on this link are what?
rmon control theory • in general rmon groups (except for stats group) consists of control rows and per control row data rows • e.g., one interface might have a control row that specifies HOW to sample data on a delta T time basis (every 30 secs make a snapshot) • one or more data rows will be built up and stored in the probe, associated with that control row • note control row per i/f and possible to have more than one (different sample times)
control rows(tables)/data rows(tables) abstract control row: owner status index i/f time associated data samples: index data #1 data #2 data #3 index more data, etc...
notes: • index mechanism must exist to tie together control and data rows • in snmpv2, one may have index that is not in table (an array of structures say with an integer index and no such int in table) (true of RMON2 groups) • view mechanism exists in RMON to allow additional time-based table thus • manager need only suck out NEW samples plus efficient access as index is creation time • manager must sometimes insert/enable control row (this is what status field is for)
notes, cont: • memory needs can be quite large • in some cases, samples will wrap • control tables limit # of buckets (number of sample sizes) • manager may need to show up and suck out data in a timely fashion
statistics {rmon 1} • etherStatsTable/etherStatsEntry • etherStatsIndex • etherStatsDataSource - which i/f • etherStatsDropEvents • etherStatsOctets - byte count, includes bad pkts • etherStatsPkts, includes bad pkts • etherStatsBroadcastPkts • etherStatsMulticastPkts • etherStatsCRCAlignErrors • etherStatsUndersizePkts (runts)
stats, cont • etherStatsOversizePkts (giants) • etherStatsFragments • etherStatsJabbers - giants with problems (e.g., CRC errs) • etherStatsCollisions - estimate of # of collisions • etherStatsPkts64Octets • etherStatsPkts65to127Octets • etherStatsPkts128to255Octets • etherStatsPkts256to511Octets • etherStatsPkts512to1023Octets • etherStatsPkts1024to1518Octets
stats, cont. • etherStatsOwner • etherStatsStatus
statistics, notes: • simplest rmon group • note histogram mechanism for counts • one entry per interface on probe • no separate control table • similar to dot3 in some ways, but dot3 is per interface, not per network • can approximate by adding values together in hub or switch (?)
history { rmon 2 } • historyControlTable (1) • historyControlEntry (1) • row entries • etherHistoryTable (2) • etherHistoryEntry (1) • row entries
history { rmon 2 } • historyControlTable/historyControlEntry • historyControlIndex - 1-1 with values in data table • historyControlDataSource - which interface • historycontrolBucketsRequested - request for data slots • historyControlBucketsGranted - how many did you get • historyControlInterval - per bucket sample time, seconds • historyControlOwner • historyControlStatus
notes: • each row when enabled causes sampling to begin on a certain interface • gathering of “buckets” (samples) in associated data table • note you can have more than one sample time on same interface (short period and long period, 1 minute, 1 hour) • samples are stored during Interval, and then new entry is created • once bucketsGranted is used up, the buckets will wrap and start rewriting the oldest buckets (circular buffer scheme)
history data table • etherHistoryTable/etherHistoryEntry • etherHistoryIndex - matches control table • etherHistorySampleIndex - unique per sample • etherHistoryIntervalStart - sysUpTime at start of sample • etherHistoryDropEvents • etherHistoryOctets • etherHistoryPkts • etherHistoryBroadcastPkts • etherHistoryMulticastPkts • etherHistoryCRCAlignErrors
history data table, cont. • etherHistoryUndersizePkts • etherHistoryOversizePkts • etherHistoryFragments • etherHistoryJabbers • etherHistoryCollisions • etherHistoryUtilization - function of etherStatsOctets and etherStatsPkts
utilization • this is fairly common in packet capture systems • roughly over time T, how full was the pipe? • utilization = packet overhead + bytes sent * 100% ----------------------------------- interval * bits possible on link • on 10BASE, bits possible would be 10**7 • packet overhead due to preamble & interframe gap • packet overhead = packets * (96+64) • bytes sent = octets * 8
utilization question/s: • how long should the period be? • how should this be interpreted with switches • interswitch (or switch to router) • servers • hosts • in light of full-duplex wires? • which should show NO collisions ...
hosts { rmon 4 } • hostControlTable • hostControlEntry • control rows • hostTable • hostEntry • data rows • hostTimeTable • hostTimeEntry • data rows
host control table • hostControlTable/hostControlEntry • hostcontrolIndex • hostcontrolDataSource • hostControlTableSize • hostcontrolLastDeleteTime - last time data deleted • hostControlOwner • hostControlStatus
hostTable (data, not time sorted) • hostTable/hostEntry • hostAddress - mac address • hostCreationOrder 1..N, relative creation order • hostIndex • hostInPkts • hostOutPkts - packet count • hostInOctets - byte count • hostOutOctets • hostOutErrors • hostOutBroadcastPkts && hostOutMulticastPkts
time table • hostTimeTable/hostTimeEntry • hostTimeAddress • hostTimeCreationOrder • hostTimeIndex • hostTimeInPkts • hostTimeOutPkts • hostTimeInOctets • hostTimeOutOctets (same as data table ... here on out)
notes: • one entry per host (mac) per interface • basically counts of bytes/packets in/out • time table is view (same data underneath) and is simply indexed by creation order • data table indexed by mac address
hostTopN { rmon 5 } • hostTopNControlTable • hostTopNControlEntry • rows • hostTopNTable • hostTopNEntry • rows
host control table • hostTopNControlTable/hostTopNControlEntry • hostTopNControlIndex • hostTopNHostIndex • hostTopNRateBase - one of seven variables (next slide) • hostTopNTimeRemaining - time left in sample period • hostTopNDuration - absolute time of sample period • hostTopNRequestedSize • hostTopNGrantedSize • hostTopNStartTime - when sample time started • owner/status
rateBase - possible variables • hostTopNInPkts • hostTopNOutPkts • hostTopNInOctets • hostTopNOutOctets • hostTopNOutErrors • hostTopNOutBroadcastPkts • hostTopNOutMulticastPkts
data table • hostTopNTable/hostTopNEntry • hostTopNReport - matches hostTopNControlIndex (which report) • hostTopNIndex - per host in report • hostTopNAddress - host mac address • hostTopNRate - amount of change in selected variable for this report period • variable selected in hostTopNRateBase
matrix group (in brief) • basically source by dest mac • count of pkts/octets (pkt count/byte count)
alarm { rmon 3 } • alarmTable/alarmEntry • alarmIndex • alarmInterval - data sample period • alarmVariable - OID of variable being sampled • alarmSampleType - absolute or delta (previous sample) • alarmValue - value during last sample period • alarmStartupAlarm - rising/falling or both • alarmRisingThreshold • alarmFallingThreshold
alarm { rmon 3 } • alarmTable/alarmEntry • ... cont .... • alarmRisingEventIndex • alarmFallingEventIndex • alarmOwner • alarmStatus
how this works (overview) • if value (counter/gauge) crosses rising threshold (and rising specified) • then generate alarm • if value crosses falling threshold (and falling specified) • then generate alarm • delta threshold sampled once per period • use to look for too many errors during period X (or your idea here ...)
event group (summary) • can generate • traps sent to monitor • events stored in local event table (log history of events) • both packet capture and alarm group can cause events stored here
conclusion - summary of capabilities • remember that measurement may have two poles, relative to length of time samples: • 1. baseline of data over time • 2. measurement of what is going on NOW • snmp focus generally on set of objects at one node - rmon focus on wire itself • over-generalization, but rmon helps you focus on NOW and the general LINK
and the problem is: SWITCHES • switches, of course and the “death of promiscuous mode” • instead of link focus, we can have all ports on switch focus, or vlan X on switch focus, or ports 1,2,3 on switch focus • however we won’t be able to see all traffic on a broadcast domain • rmon too expensive for cheaper switches at this time • have to focus on key backbone switches