Download
1 / 18
180 likes | 197 Views
Analyzing Massive Graphs - ParT I. Dr. Michael Fire. Graphs/Networks are Everywhere. Some examples: Online Social Networks Computer Networks Financial Transactions Networks Protein Networks Neuron Networks Animal Social Networks. Networks/Graphs are Well-Studied.

E N D
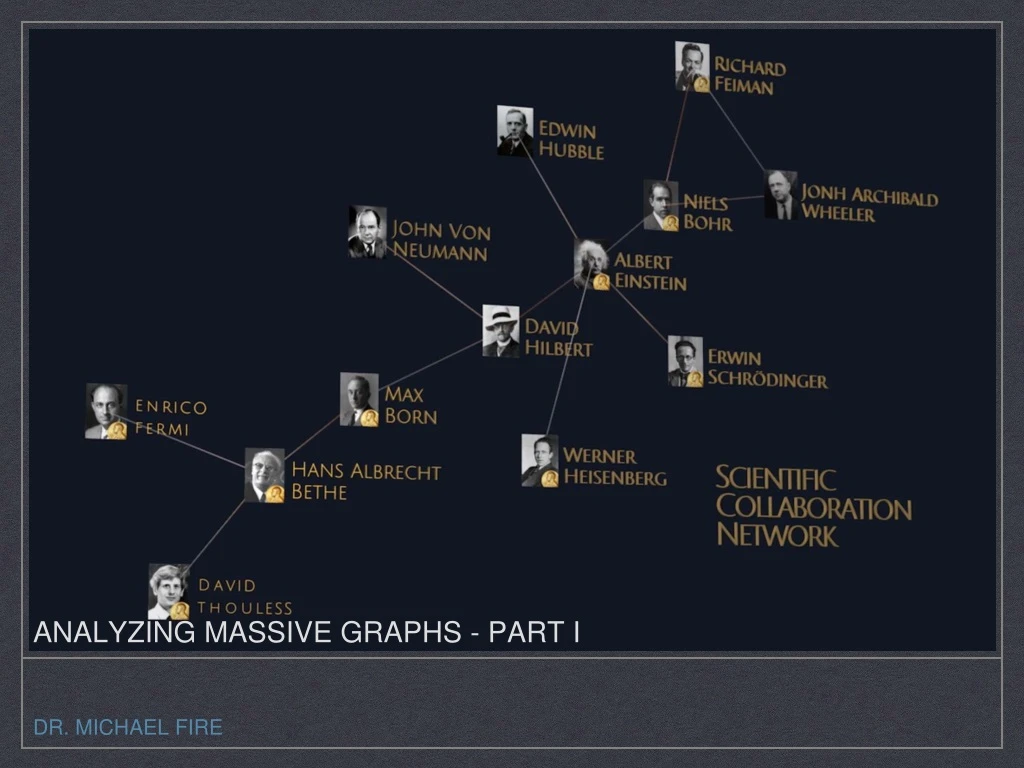
Analyzing Massive Graphs - ParT I Dr. Michael Fire
Graphs/Networks are Everywhere • Some examples: • Online Social Networks • Computer Networks • Financial Transactions Networks • Protein Networks • Neuron Networks • Animal Social Networks
Networks/Graphs are Well-Studied • Due to their cross-disciplinary usefulness today, there are: • Numerous graph algorithms • Many tools/frameworks to analyze graphs • Many tools to visualize graphs igraph Networkx
Graphs - The Basics A graph consists of a set of vertices (nodes), and a set of links (edges). The links connect vertices. There are direct graphs, like Twitter, and undirected graphs, like Facebook.
Practical Network Analysis • There are countless interesting things that we can learn from graphs: • Graph Algorithms and Their Complexity • Network Evolution Models • Dynamic Networks • Spreading Phenomena • Temporal Networks • Motifs In today’s lecture, we are going to learn how to use networks as data structures to analyze and infer insights from data
Network Analysis Tools • Networkx - a Python Library for graph analysis • iGraph - a library collection for creating and manipulating graphs and analyzing networks. It is written in C and also exists as Python and R packages. • NodeXL - NodeXL Basic is an open-source template that makes it easy to explore network graphs • NetworKit - NetworKit is an open-source tool suite for high-performance network analysis. Its aim is to provide tools for the analysis of large networks. • SGraph - A scalable graph data structure. The SGraph provides flexible vertex and edge query functions, and seamless transformation to and from an SFrame object
Networkx • Pros: • Easy and fun to use • Mature library • Many implemented graph algorithms • Vertices can be anything and edges can store attributes • Easy to visualize graphs and to save them in many formats • Cons: • Doesn’t work well with large graphs • Slow
iGraph • Pros: • Mature library • Many implemented graph algorithms • Pretty fast • Cons: • Little tricky to use • Doesn’t work well with very large graphs
SGraph • Pros: • Can work with very large graphs (billions of links) • Part of the TuriCreate Eco-system (works great with SFrame) • Cons: • Relatively little functionality
Network Visualization Tools Cytoscapeis an open source bioinformatics software platform for visualizing molecular interaction networks. Cytoscape can be used to visualize and analyze network graphs of any kind. Yeast Protein–protein/Protein–DNA interaction network visualized by Cytoscape.
Network Visualization Tools Gephiis an open-source network analysis and visualization software package written in Java
Network Visualization Tools D3.jsis a JavaScript library for producing dynamic, interactive data visualizations in web browsers. We can use D3.js to dynamically visualize networks
Some Terminology • There are many interesting vertex/links/networks properties that are widely used in the context of analyzing networks. Here is a short list of terms we will need for the following examples: • Degree - the number of edges incident to a vertex • Clustering Coefficient - a measure of the degree to which nodes in a graph tend to cluster together. • Betweenness centrality - a centrality measure which quantifies the number of times a vertex/edge acts as a bridge along the shortest path between two other nodes/edges. • Modularity - measures the strength of division of a graph into modules (also called groups, clusters or communities) • Strongly Connected Component - a maximal group of vertices that are mutually reachable • Weakly Connected Component - a maximal group of vertices that are mutually reachable by violating the edge directions. • Common Friends - Given two vertices u and v, the common friends of u and v is the size of the common set of friends that both u and v possess.
Some Useful Algorithms • Community Detection • Shortest Path • Closeness Centrality • PageRank • k-Core Decomposition
Recommended Read: • Network Science, Class 1 Introduction, by Albert László Barabási • Top 30 Social Network Analysis and Visualization Tools by Devendra Desale • k-Core Decomposition: A tool for the visualization of Large Scale Networks by Alvarez-Hamelin, José Ignacio, et al.