Download
1 / 24
240 likes | 393 Views
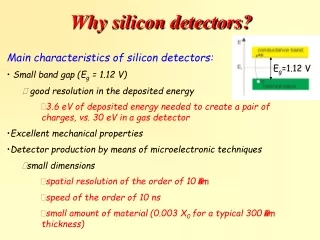
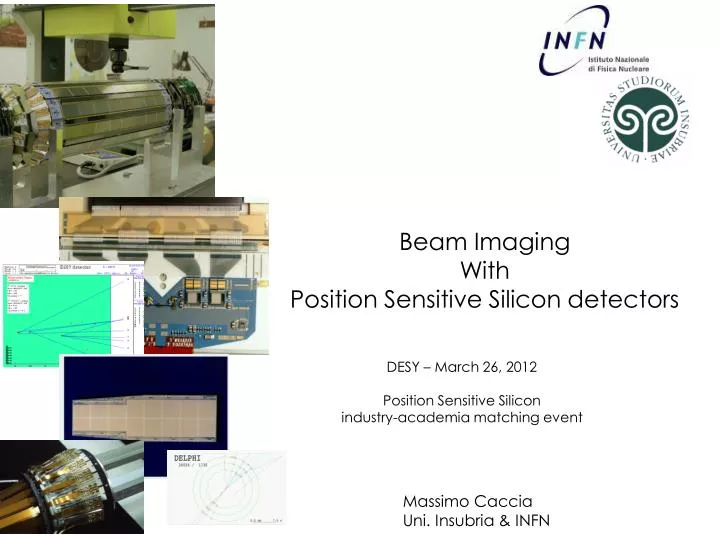
Beam Imaging With Position Sensitive Silicon detectors . DESY – March 26 , 2012 Position Sensitive Silicon industry-academia matching event. RAPSODI. Massimo Caccia Uni. Insubria & INFN. Exemplary illustration 1:

E N D
Beam Imaging With Position Sensitive Silicon detectors DESY– March 26, 2012 Position Sensitive Silicon industry-academiamatchingevent RAPSODI Massimo Caccia Uni. Insubria & INFN
Exemplary illustration 1: Beam Imaging with micro-strip detectors at the ClatterbridgeCyclotronfor Proton Therapy* [reference & ackn.: Phil Allport & G.L.Casse, Liverpool] Based on the LHCb-VELO Microstrip half-moons, withstanding up to 1016 1MeV neutronequivalent cm-2 Radial strips, measuring the azimuthal coordinate Semi-circular strips, measuring the radial coordinate [*Scanditronix MC-60 cyclotron, delivering 62 MeVprotonswithintensityto 10 nA, with a flatbeam spot widthof 34 mm, suitablycollimated]
Exemplary illustration 2: the MIMOTERA: a monolithic pixel detector for real-time beam imaging and profilometry [U.S. patent no. 7,582,875 contact: massimo.caccia@uninsubria.it] 17.136×17.136 mm2 28 columns(30 clocks) • AMS CUA 0.6 µm CMOS 15 µm epi, MimoTera • chip size: 17350×19607µm2 • array 112×112 square pixels, • foursub-arrays of 28×112 pixels read out in paralleltread/integr<100µs (i.e. 10 000 frames/second) • Backthinnedto the epi-layer(~15 µm ), back illuminatedthrough an ~80 nm entrance window Subarray 1 Subarray 3 Subarray 2 Subarray 0 112 rows(114 clocks) digital • no dead time
Essentials onthe MIMOTERA[continued]: • pixel 153×153µm2 square pixels, • two 9×9 interdigitedarrays (A and B) of n-well/p-epicollecting diodes (5×5 µm2) +twoindependentelectronics – avoidingdead area, Layout of one pixel • In-pixelstoragecapacitors – choice ~0.5pF or ~5pF to copewith signal range (poly1 over toxcapacitors), B A 153 mm • Charge To Voltage Factor = ~250nV/e- @ 500fFwellcapacity of ~ 36 MeV • Noise ~1000 e- Å 280 e-kTC (ENC) @ 500fF
Original push for the MIMOTERA development: minimally invasive real-time profilometry of hadrontherapy beams by secondary electron imaging [IEEE Trans.Nucl.Sci. 51, 133 (2004) and 52, 830 (2005))] Step 1 Step 2 Step 3 Basic principle: collection and imaging of secondary 20 keV electrons emitted by sub-μmthin Aluminum foils The SLIM installed on an extraction line at the Ispra JRC-Cyclotron (p, 2H, 4H at energies 8-38 MeV, 100 nA- 100uA) Secondary electrons emitted by a proton beam through a multi-pin hole collimator (Ø = 1mm, pitch = 1.5-6.5 mm) Complemented byresults on beam imaging by DIRECT IMPACT on the sensor
Assisting the AD-4 [ACE] collaboration [ACE, http://www.phys.au.dk/~hknudsen/introduction.html] “Cancer therapy is about collateral damage” compared to a proton beam, an antiproton beam causes four times less cell death in the healthy tissue for the same amount of cell deactivation in the cancer. [courtesy of ACE] Michael Holzscheiter, ACE spokesperson (left), retrieves an experimental sample after irradiation with antiprotons, while NielsBassler (centre) and Helge Knudsen from the University of Aarhus look on [courtesy of ACE]
Shot-by-shot beam recording at the CERN anti-proton decelerator tests Single shot picture • beam characteristics: • 120 MeV energy • 3x10⁷ particles/spill • 1 spill every 90” • FWHM ~ 8 mm • acquisition modality: - triggered • imaging modality: - differential • radiation damage: - irrelevant so far [max no. of spills on a detector: 1436] • data taking runs: - September 2009 - June 2010 - October 2010 - June 2011
Profiling the beam • [PRELIMINARY RESULTS: • FWHM calculation checked, • errors on the GAF still being evaluated] With the MIMO, overlaying the 120 events in run #37 events to mimic the Gaf With a GafChromic Film, integrating the spills over a full run …and PROJECTING FWHM = 7.11 ± 0.05 mm FWHM = 7.64 ± 0.05 mm
Monitoring the intensity fluctuations MIMO Vs UNIDOS* *The PTW UNIDOS is a high performance secondary standard and referenceclassdosemeter / electrometer
HIT [Heidelberg Ion-Beam Therapy Center]: Quality control of pencil Carbon Ions & proton beams http://www.klinikum.uni-heidelberg.de/index.php?id=113005&L=en The accelerator complex [patients treated since 2008] The facility building The beam parameters Interested in high granularity (in time & space) and linearity against the deposited energy
I = 7x10⁷ particles/s, C ions Time development of the beam Data taking conditions & qualitative information • beam time characteristics: • duty cycle 50% • spill duration 5 s • FWHM ~f(particle, intensity, energy) • acquisition modality: - free run • imaging modality: • radiation damage: - relevant but not dramatic [Total exposure time so far ~ 3h; about 1’-2’ per run at a specified nrj, intensity] • data taking runs: - May 2010 - October 2010
Quantitative information (C ions) Intensity Scan Energy Scan Intensity Scan
Imaging the LARN Tandem beams at Namur (B) • Main interests: • The MIMO as a real-time, high granularity “digital” alumina screen, to optimize the set-up • QC of the beam in terms of homogeneity • quick measurement of the absolute intensity (particle counting!)
Data taking conditions & qualitative information • beam time characteristics: • continuous beams! • any ion (!) with an energy in MeV/amu range • intensities [103;108] p/cm2/s range • acquisition modality: - free run; MIMOin vacuum • radiation damage: - may really be dramatic! [Total exposure time so far ~ 60h; p, , C ion beams] • imaging modality: • standard: signal - pede • differential: (i,j,n) = signal (i,j,n) - signal(i,j,n-1) • based on < 2(i,j,N) > • digital with a pixel dependent threshold • data taking runs: - July 2008, April 2009 + series of short runs since April 2010 performed by the people at LARN - June 2011 [new DAQ commissioning] + February 2012 [full system qualification] Image obtained by counting with pixel dependent thresholds
Four runs: • July 2008: proof of principle • April 2009: improved set-up + extensive data set • June 2011: commissioning new Data Acquisition System/extensive tests on different imaging modalities • February 2012: full system commissioning and qualification • The MIMOTERA run in vacuum • Real-time data handling (e.g. sum of a user specified number of frames) implemented • Robust algorithms against radiation related effects tested • exhaustive data set recorded: • Scan over 3 orders of magnitude in intensity (p, I=[104 ÷ 107] p/cm2/s, 1.2 MeV & 3 MeV energy) • Energy scan with protons (3.5 to 1 MeV) • Tested with C ions (Z = +3, 106 particles/cm2/s, 7 MeV) • Tested with different readout frequencies (2.5 to 20 MHz)
Costruction of a flat beam image overlapping different number of frames Real-time profiling (2009 run) Bottom: image of a tilted beam, obtained overlapping a user defined number of frames 2 frames, single protons visible 10 frames 20 frames
Real-time profiling (2011 run) Two images of a proton beam showing the footprint of a fiber (right) and the fiber + the LARN reference detector in the beam area (bottom)
Exemplary Linearity plots, up to 8.8 x 10⁶ particles/cm2/s [limited by the reference instrument in use at Namur] • protons, 1.2 MeV energy; • MIMO clocked at 2.5 MHz • differential mode • Y axis: MIMO response; X axis: LARN reference instrument. The observable corresponds to the mean number of pixels NOT fired in a user specified region of interest in the beam core • clocking at 25 MHz, we can use the MIMO in counting mode till ~ 108 particles/cm2/s
What’s next? Enhanced tools for rester-scanning [disclaimer: my own personal point of view…] Siemens AG – HealthCare – Martin Brauer
Current System in use @Siemens Based on MWPC for profilometry and ionization chambers for intensity measurements
Three issues with MWPC: • MWPC are essentially 1D detectors • granularity (with thin beams] • apparent beam offset induced by rays
Is there any room for Position Sensitive Silicon Detectors? Siemens’ view on the optimal detector [Martin Brauer]: Wishful thinking from PYRAMID [J. Gordon] My main concern is more on Radiation Hardness rather than material… [dose rate ~ Gy/minute]
Conclusions • Position Sensitive Silicon detectors may certainly be considered a mature technology, yet enjoying a rapid development steered by the HEP community • “Tools” are ready and several preliminary exercises have been performed • we just need to foster the collaboration with the end-users and I’m sure we will have a lot of fun and more to report by the time of the next “event”!