Download
1 / 26
260 likes | 315 Views
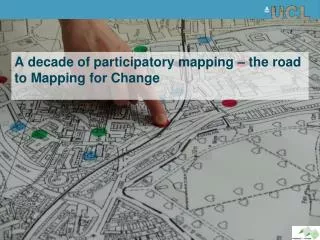
Participatory Mapping. Vanda Altarelli 2016 Master in Human Development and Food Security. Participatory mapping. During the 90 ’ s the most important breakthrough was the realisation that local people could make brilliant maps of their environment

E N D
Participatory Mapping Vanda Altarelli 2016 Master in Human Development and Food Security
Participatory mapping • During the 90’s the most important breakthrough was the realisation that local people could make brilliant maps of their environment • In the first PRA event in Kalmanardj village farmers build a remarkable 3D model of their watershed. There the first social and resource maps were made. • This threw all social researchers/PRA practitioners back.
Participatory mapping • This event marked the beginning of social/environmental mapping. • Although in the beginning mapping involved NRM, in a very short time everything started to be mapped. • Social mapping, identifying peoples, livestock, children who go or do not go to school, wealth and social mapping, recently indigenous peoples’ territories for the purpose of claiming/registering their lands.
Participatory mapping • Health mapping for people with specific health problems, HIV related concentration, ebola, disabilities, special knowledge, etc. concentration of breast cancer (UK),.. • Mobility mapping, showing people’s movements (how far they go, where and how often….) • Water and sanitations • Farm mapping • Prevention of crime, etc.
Village Resources Map • To learn about a community, its resource basis and the local perceptions of resources by different groups. Maps provide a visual image of village conditions that are easy for • all villagers to understand. Natural resource maps can show land conditions, land use, land tenure, water sources and forest coverDifferent methods can be used: hand drawing, or more sophisticated ones like 3 Dimensional Mapping, GIS generated maps. • Useful starting point to initiate a dialogue with a communityand for awareness raising
Questions to ask while facilitating • Where is the original part of the village? • What resources are in ample supply and which ones are in shortage? • Who makes decisions about who can use the land? • Do you have land held in common? • Where do people go for water, firewood, grazing? How long does it take? • Are rights of access different for women and men or for people from different ethnic or socio-economic background? • Below is an example of such a map
Social Mapping • Social maps can show the living conditions of villagers, especially the poorest of the poor. Maps can illustrate: a) water collection and distribution points; b) types and location of housing; c) where services are accessed; d) location and numbers of the poorest of the poor households. These characteristics may be indicated by creating different symbols for • houses of different quality, colour coding specific areas within the community or by drawing arrows between houses and service providers.
Maps • The map above is of a whole village. For ease of explanation, both natural resource mapping and social mapping have been included on the same map. • The maps can be divided into smaller sections to make planning, monitoring and evaluation more precise. • Make sure to always put a legend, date and, if possible, the names of the map makers.
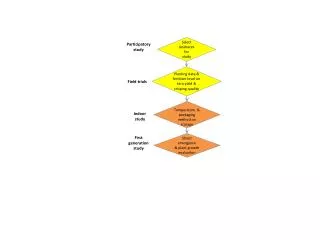
Participatory 3D Mapping • The preparation of the 3D mapping exercise includes several activities: • establishment of an organizing committee • consulting and mobilizing stakeholders • choosing the appropriate mapping scales (vertical • and horizontal) and area of interest • acquiring topographic map sheets from the Survey • of the country • generating digital contours and preparing a base • map • procuring inputs • making logistical arrangements
3 D Maps: Process • Organise focus groups of participants who are most likely to know all the features of the surrounding environment. • Make sure that both women and men participate, or organise separate focus groups if necessary. • Ask the participants to start by showing the location of the features (physical, sacred, social,). • Group discussion follows on local criteria of wealth and well-being until agreement is reached.
3D mapping.. • Ask local leaders to identify youth (men and women) who can be trained for GPS handling, reading and recording • Train these people to GPS handling; • Get all sketch maps ready: older people broadly identify the features on the 3 D map and identify their characteristics; • Sketch these features on the preliminary sketch maps and then the trained people go and take the GPS readingsInput data on computer and produce maps
3D mapping.. • Bring results back to community for validation. • Then, depending on the purpose of the exercise, start working with groups to make community plans. • For more information on 3D Participatory Mapping, visit: http://www.iapad.org/ • There you can also download the training Kit on Participatory Spatial Information Management and Communication
Current use of mapping • Now, with the development of new technologies, mapping is made easier, faster and reliable. • Example 1: Mapping Indigenous Lands in W. Kalimantan, Indonesia by using portable, satellite-linked data loggers, Dayak communities members create maps that delimit their territories so that they can claim them. This same technology can be used to monitor changes(www.forestpeople.org)
Current use of mapping… Example 2: Community based real time forest illegal activities monitoring in Cameroun Information is collected using a smartphone by members of a local community. Using a bespoke app, the information is coded and then transmitted to an online repository via a satellite modem transmitter. The information is stored in a central geographical database where it can be analysed and/or automatically re-broadcast for in-field verification of the reports, which can be searched for numerous variables, (name of company involved, type of infraction etc )
Current use of mapping… The verification stage allows for collection of additional information about any given incident reported; e.g. the approximate date when it took place, whether it is isolated or a regular occurrence, its author, possible causes and observed impacts and for documenting it visually. The verifier could also assess how the information should be acted on by enforcement agencies Once verified, information would to be sent on to enforcement or other agencies http://monitor.mappingforrights.org/
Transect Walk • Direct observation & recording while walking a straight line through a cross-section of an area (village, slum or surroundings) along which a number of issues are recorded. It allows to refine spatial information and to summarise local conditions. • Undertaken by one or two team members accompanied by a mix of participants such as women and men, young and old.
Questions to ask • What are the major activities carried out in each zone of the community? By whom? • What services and infrastructure are available in each zone? • What are the natural resources available in each zone? Who uses them and for what? • What are the economic opportunities? • Who has right of access to these resources (women, men, ethnic or social groups)? • What are the problems? • What to do to overcome them?
Materials needed • For the walk itself: • ● notebook and pen • ● appropriate clothing and footwear for the area and time of year • ● maps or aerial photographs, if available • ● compass, • ● GPS if the details of the transect are to be incorporated into a GIS, • A camera with which to take pictures of the most salient places
Steps for conducting a TW • 1. Identify a group of key informants. Ideally, they should include older and younger people, • women and men, and they should all be willing to walk some distance, and share their observations. • 2. Discuss with the group the purpose of the walk, and decide on the path that should be taken to cover the full geographical variation in the area. Maps or aerial photographs may be of use, if available. For monitoring and evaluation purposes, it is important that the line of the transect walk can be readily found again and again, possibly after substantial periods of time (hence the usefulness of a GPS).
Steps …. • 3. Decide with the key informants what parameters should be used for recording observations.Typical ones might include land type, soil type, natural vegetation (recording certainkey ‘indicator’ species), local fauna, crops, water bodies, and land ownership. Local definitionsof these parameters should be explored – for example, names of land and soil types, or of locally important plant or animal species. It is best to limit the parameters covered to key features; trying to collect too much information may result in confusion.
Steps • 4. In general, the easiest and most stimulating part of transect walks is the walk itself and thediscussions that arise during it, with the local people as experts. Documenting it afterwardscan be more difficult. It helps to clearly decide specific observation points along the transectwalk at which everyone stops to record all parameters. • 5. Share the information gathered with member of the whole community for validation and enrichment.