Download

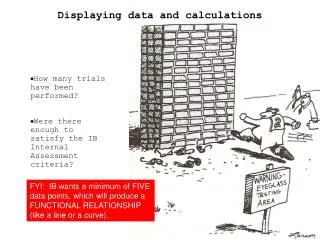
1 / 81
810 likes | 824 Views
Organizing and Displaying Data. Data Files. Data is almost always stored in a format where: ROWS are cases or individuals and COLUMNS are variables. SYS-. DIA-. OUT-. CHOL. ID. EJEC. VOL. VOL. OCCLU. STEN. TIME. COME. AGE. SMOKE. BETA. SURG. a. 390. 72. 36. 131. 0.

E N D
Data Files Data is almost always stored in a format where: ROWS are cases or individuals and COLUMNS are variables
SYS- DIA- OUT- CHOL ID EJEC VOL VOL OCCLU STEN TIME COME AGE SMOKE BETA SURG a 390 72 36 131 0 0 143 0 49 2 2 59 0 279 52 74 155 37 63 143 0 54 2 2 68 1 391 62 52 137 33 47 16 2 56 2 2 52 0 201 50 165 329 33 30 143 0 42 2 2 39 0 202 50 47 95 0 100 143 0 46 2 2 74 1 69 27 124 170 77 23 143 0 57 2 2 NA 2 310 60 86 215 7 50 40 0 51 2 2 58 0 392 72 37 132 40 10 9 5 56 2 2 75 0 311 60 65 163 0 40 142 0 45 2 2 72 0 393 63 52 140 0 10 142 0 46 2 2 90 0 70 29 117 164 50 0 142 0 48 2 2 72 0 203 48 69 133 0 27 142 0 54 2 2 NA 0 394 59 54 133 30 13 142 0 39 2 1 NA 0 204 50 67 135 37 63 141 0 49 2 2 86 2 280 53 65 138 0 33 140 0 58 2 1 49 0 55 17 184 221 57 13 5 1 50 2 2 70 2 79 37 88 140 37 47 118 5 58 2 2 NA 0 205 45 106 193 33 43 140 0 47 1 1 38 1 206 43 85 150 0 50 23 5 51 2 2 61 0 312 60 59 149 7 37 139 0 43 2 1 56 0 80 38 103 168 47 43 100 1 55 2 2 62 1 281 57 53 124 0 57 140 0 58 2 1 93 0 207 44 68 121 27 60 139 0 55 2 2 63 1 282 51 53 109 0 77 139 0 41 2 2 45 4 396 63 58 157 0 73 139 0 51 2 2 60 0 208 49 81 157 13 13 139 0 49 2 2 60 0 209 48 58 112 0 0 72 1 56 2 2 57 0 283 58 71 167 27 0 138 0 45 2 1 46 0 210 42 92 159 0 0 139 0 57 2 2 58 0 397 68 50 156 0 100 138 0 51 2 1 NA 0 211 43 146 259 47 33 3 1 56 2 2 70 0 398 67 43 130 0 70 138 0 49 2 2 NA 3 284 52 70 146 0 23 137 0 47 1 2 NA 0 399 63 73 195 27 0 136 0 36 1 1 61 0 285 54 62 133 33 23 137 0 38 2 2 NA 0 71 37 93 148 47 0 137 0 59 2 2 NA 0 286 51 65 133 43 7 136 0 54 2 2 NA 0 212 42 95 163 40 10 109 3 57 2 2 NA 4 400 66 49 144 10 50 65 1 52 2 2 55 0 287 54 66 145 7 40 136 0 47 2 2 62 0 81 39 144 237 13 87 136 0 39 2 2 56 3 813 63 52 141 0 47 43 3 48 2 2 NA 0 68 30 219 314 33 45 76 1 53 1 2 NA 0 288 59 39 94 0 0 135 0 47 1 2 63 0 407 67 39 117 0 73 53 1 57 2 2 62 2 a Complete Data Table on Male Heart Attack Patients NA = Not Available(missing data code).
Row 1 Variable values for subject #390 SYS- DIA- OUT- CHOL ID EJEC VOL VOL OCCLU STEN TIME COME AGE SMOKE BETA SURG 390 72 36 131 0 0 143 0 49 2 2 59 0 279 52 74 155 37 63 143 0 54 2 2 68 1 391 62 52 137 33 47 16 2 56 2 2 52 0 201 50 165 329 33 30 143 0 42 2 2 39 0 202 50 47 95 0 100 143 0 46 2 2 74 1 69 27 124 170 77 23 143 0 57 2 2 NA 2 392 72 37 132 40 10 9 5 56 2 2 75 0 310 60 86 215 7 50 40 0 51 2 2 58 0 311 60 65 163 0 40 142 0 45 2 2 72 0 393 63 52 140 0 10 142 0 46 2 2 90 0 Column 3 Systolic volume for the first 10 subjects Portion of the Data Table on Male Heart Attack Patients
Variables ID: A patient identifier instead of a name. EJEC: Ejection fraction, % of blood ejected from left ventricle in one beat. SYSVOL: End-systolic volume, a measure of the size of the heart. DIAVOL: End-diastolic volume. OCCLU: Occlusion score (% of myocardium of the left ventricle supplied by arteries that are totally blocked).
Variables STEN: Stenosis score (% supplied by arteries that are significantly narrowed but not completely blocked). TIME: Time in months from when patient was admitted until OUTCOME. OUTCOME: Coded variable 0 = alive at last follow up 1 = sudden cardiac death 2 = death within 30 days of heart attack 3 = death from heart failure 4 = death during / after coronary surgery 5 = non-cardiac death
Variables SMOKE: Coded variable 1 = patient continued to smoke 2 = patient did not continue smoking BETA: Coded variable 1 = patient took beta blockers 2 = patient did not take beta blockers AGE: Patient’s age at admission (years) CHOL: Blood cholesterol (mmoles/litre) SURG: Coded variable 0 = no surgery 1 = surgery as part of a trial 2 = surgery for symptoms within 1 year 3 = surgery for symptoms within 1 to 5 years 4 = surgery for symptoms after 5 years
In this presentation we will look at… Tools to help us: • explore search for important features/messages • communicate report the important features/messages Two types of tools: • visual summaries plots, graphs, charts, etc. • numerical summaries center, spread, percentages, frequencies, etc.
Types of Variables A quantitative or numeric variable measures or counts something. e.g. height of a student, number of sisters A qualitative or categorical or nominal variable defines group membership. e.g. gender, ethnicity
Quantitative/Numeric Variables Continuous variables have no gaps between possible values. (measurements) e.g. weight, temperature Discrete variables have gaps between possible values. (counts) e.g. number of brothers Variables with few repeated values are treated as continuous. Variables with many repeated values are treated as discrete.
Qualitative (Categorical) Variables A categorical or nominal variable is one that has no order. e.g. ethnicity, gender An ordinal variable is one where the categories can be ordered. e.g. income group (low, middle, high);age group (young, old) Likert scale, e.g. (1 = strong disagree,…, 5 = strongly agree)
Types of Variables Quantitative (measurements and counts) Qualitative (define groups) Categorical/Nominal (no idea of order) Ordinal (fall in natural order) Continuous (few repeated values) Discrete (many repeated values)
SYS- DIA- OUT- CHOL ID EJEC VOL VOL OCCLU STEN TIME COME AGE SMOKE BETA SURG a 390 72 36 131 0 0 143 0 49 2 2 59 0 279 52 74 155 37 63 143 0 54 2 2 68 1 391 62 52 137 33 47 16 2 56 2 2 52 0 201 50 165 329 33 30 143 0 42 2 2 39 0 202 50 47 95 0 100 143 0 46 2 2 74 1 69 27 124 170 77 23 143 0 57 2 2 NA 2 310 60 86 215 7 50 40 0 51 2 2 58 0 392 72 37 132 40 10 9 5 56 2 2 75 0 311 60 65 163 0 40 142 0 45 2 2 72 0 393 63 52 140 0 10 142 0 46 2 2 90 0 70 29 117 164 50 0 142 0 48 2 2 72 0 203 48 69 133 0 27 142 0 54 2 2 NA 0 394 59 54 133 30 13 142 0 39 2 1 NA 0 204 50 67 135 37 63 141 0 49 2 2 86 2 280 53 65 138 0 33 140 0 58 2 1 49 0 55 17 184 221 57 13 5 1 50 2 2 70 2 79 37 88 140 37 47 118 5 58 2 2 NA 0 205 45 106 193 33 43 140 0 47 1 1 38 1 206 43 85 150 0 50 23 5 51 2 2 61 0 312 60 59 149 7 37 139 0 43 2 1 56 0 80 38 103 168 47 43 100 1 55 2 2 62 1 281 57 53 124 0 57 140 0 58 2 1 93 0 207 44 68 121 27 60 139 0 55 2 2 63 1 282 51 53 109 0 77 139 0 41 2 2 45 4 396 63 58 157 0 73 139 0 51 2 2 60 0 208 49 81 157 13 13 139 0 49 2 2 60 0 209 48 58 112 0 0 72 1 56 2 2 57 0 283 58 71 167 27 0 138 0 45 2 1 46 0 210 42 92 159 0 0 139 0 57 2 2 58 0 397 68 50 156 0 100 138 0 51 2 1 NA 0 211 43 146 259 47 33 3 1 56 2 2 70 0 398 67 43 130 0 70 138 0 49 2 2 NA 3 284 52 70 146 0 23 137 0 47 1 2 NA 0 399 63 73 195 27 0 136 0 36 1 1 61 0 285 54 62 133 33 23 137 0 38 2 2 NA 0 71 37 93 148 47 0 137 0 59 2 2 NA 0 286 51 65 133 43 7 136 0 54 2 2 NA 0 212 42 95 163 40 10 109 3 57 2 2 NA 4 400 66 49 144 10 50 65 1 52 2 2 55 0 287 54 66 145 7 40 136 0 47 2 2 62 0 81 39 144 237 13 87 136 0 39 2 2 56 3 813 63 52 141 0 47 43 3 48 2 2 NA 0 68 30 219 314 33 45 76 1 53 1 2 NA 0 288 59 39 94 0 0 135 0 47 1 2 63 0 407 67 39 117 0 73 53 1 57 2 2 62 2 a Complete Data Table on Male Heart Attack Patients NA = Not Available(missing data code).
Variables N ID: A patient identifier instead of a name. EJEC: Ejection fraction, % of blood ejected from left ventricle in one beat. SYSVOL: End-systolic volume, a measure of the size of the heart. DIAVOL: End-diastolic volume. OCCLU: Occlusion score (% of myocardium of the left ventricle supplied by arteries that are totally blocked). C C C C Classify each variable according to its type. N = nominal, O = ordinal, C = continuous/discrete
Classify each variable by type (C or O or N) Variables C STEN: Stenosis score (% supplied by arteries that are significantly narrowed but not completely blocked). TIME: Time in months from when patient was admitted until OUTCOME. OUTCOME: Coded variable 0 = alive at last follow up 1 = sudden cardiac death 2 = death within 30 days of heart attack 3 = death from heart failure 4 = death during / after coronary surgery 5 = non-cardiac death C N
Classify each variable by type (C or O or N) Variables N SMOKE: Coded variable 1 = patient continued to smoke 2 = patient did not continue smoking BETA: Coded variable 1 = patient took beta blockers 2 = patient did not take beta blockers AGE: Patient’s age at admission (years) CHOL: Blood cholesterol (mmoles/litre) SURG: Coded variable 0 = no surgery 1 = surgery as part of a trial 2 = surgery for symptoms within 1 year 3 = surgery for symptoms within 1 to 5 years 4 = surgery for symptoms after 5 years N C C O? N
Reporting Findings in Tables • Don’t try to do too much in the table. Model tables off of published research. • Use white space effectively. • Make sure tables and text refer to each other, however you do not need to write everything in table as text. If you interpret one or two key findings in a table, the reader should be able to handle the rest. • Use some aspect of the data to order and group rows/columns in table, e.g. size, chronology, or to show similarity or invite comparisons.
Reporting Findings in Tables Example: Exercise 3 Grove Comparisons between the Intervention group and the Control group are the focus here. The P column contains p-values from an appropriate test comparing the two groups on the given variables.
Reporting Findings in Tables • If appropriate, frame the table with summary statistics in rows and columns to provide a standard of comparison. • It is useful to round numbers in a table to one or two decimal places.
Woman’s Woman’s New Idea Listener Time TV Guide Day Weekly Jan 1 to Jun 30, 1999 67,070 90,521 165,914 126,640 38,136 241,356 Jul 1 to Dec 31,1998 63,444 90,018 162,182 126,486 38,236 248,786 Jan 1 to Jun 30,1998 59,039 92,786 175,002 129,920 38,635 258,806 circulation figures between magazines. circulation comparisons when the circulation data are in columns. Example 2 The three tables below show six-monthly circulation figures for six weekly magazines in New Zealand. Table 1: Circulation of Weekly Magazines • We want to compare It is easier to make
Table 2: Circulation of Weekly Magazines Jan 1 to Jun 30, 1999 Jul 1 to Dec 31, 1998 Jan 1 to Jun 30, 1998 New Idea 67,070 63,444 59,039 Listener 90,521 90,018 92,786 Woman’s Day 165,914 162,182 175,002 Woman’s Weekly 126,640 126,486 129,920 Time 38,136 38,236 38,635 TV Guide 241,356 248,786 258,806 Example 1 Numbers need to be rounded. Magazines need to be ordered by circulation.
Table 3: Circulation of Weekly Magazines (in thousands) Jan 1 to Jun 30, Jul 1 to Dec 31, Jan 1 to Jun 30, Average 1998 1998 1999 TV Guide 259 249 241 250 Woman’s Day 175 162 166 168 Woman’s Weekly 130 126 127 128 Listener 93 90 91 91 New Idea 59 63 67 63 Time 39 38 38 38 Example 1 Row averages allow comparisons between the most recent circulation data and the average for the magazine.
Table 3: Circulation of Weekly Magazines (in thousands) Jan 1 to Jun 30, Jul 1 to Dec 31, Jan 1 to Jun 30, Average 1998 1998 1999 TV Guide 259 249 241 250 Woman’s Day 175 162 166 168 Woman’s Weekly 130 126 127 128 Listener 93 90 91 91 New Idea 59 63 67 63 Time 39 38 38 38 Average 126 122 122 Example 1 Column averages allow comparisons between the circulation data and the average for the 6 magazines for the time period.
Table 3: Circulation of Weekly Magazines (in thousands) Jan 1 to Jun 30, Jul 1 to Dec 31, Jan 1 to Jun 30, Average 1998 1998 1999 TV Guide 259 249 241 250 Woman’s Day 175 162 166 168 Woman’s Weekly 130 126 127 128 Listener 93 90 91 91 New Idea 59 63 67 63 Time 39 38 38 38 Average 126 122 122 Example 1 Verbal Summary: During 1998 and the first-half of 1999 the TV Guide had the highest circulation for weekly magazines in New Zealand.
Univariate Analyses Variable type dictates how we display and summarize the distribution. For nominal or ordinal data the notion of distribution is typically the percentage of observations falling into each of the categories or ordered levels. For numeric data distribution refers shape of the distribution, central tendency or “average”, and variability or spread.
Types of Variables Quantitative (measurements and counts) Qualitative (define groups) Categorical (no idea of order) Ordinal (fall in natural order) Continuous (few repeated values) Discrete (many repeated values)
Displays for Numeric Variables • Stem-and-Leaf Plots (simple, but outdated) • Histograms & Smooth Density Estimates • Quantile and Outlier Boxplots
19.9 Belgium 17.4 Australia 11.6 Finland 10.1 Czechoslovakia 5.4 Hong Kong 13.1 W. Germany 26.8 Kuwait 10.3 Israel 25.6 Portugal 10.5 Norway 12.1 N. Ireland 15.7 Switzerland 15.8 Canada 12.5 Bulgaria 20.1 Austria 12.0 E. Germany 20.0 France 13.0 Denmark 15.3 Ireland 17.1 Hungary 21.1 Greece 20.1 New Zealand 11.3 Netherlands 10.4 Japan 9.8 Sweden 12.6 Singapore 14.6 Poland 18.6 United States 10.1 England & Wales 12.0 Scotland Traffic Death-Rates (per 100,000 population) for 30 Countries Data for 1983, 1984 or 1985 depending on the country (prior to reunification of Germany)
Units: 17 | 4 = 17.4 deaths per 100,000 5 4 6 7 Units: 1 | 7 = 17 deaths per 100,000 8 0 5 9 8 10 1 1 3 4 5 0 Collapse to 11 3 6 0 12 0 0 1 5 6 1 0 0 0 0 0 1 1 12 stems 13 0 1 1 2 2 2 2 3 3 3 3 14 6 1 5 5 15 3 7 8 1 6 6 7 7 16 1 9 17 1 4 18 6 2 0 0 0 0 1 19 9 2 20 0 1 1 2 21 1 2 6 7 22 23 24 25 6 26 8 Traffic Death-Rates (per 100,000 population) for 30 Countries
Traffic Death-Rates (per 100,000) for 30 Countries Stem-and-Leaf plot from JMP
Histograms Divide range of data into equal width class intervals and use the number or percentage of observations in each class interval to determine the height of a bar centered over each interval. Traffic Death-Rates (per 100,000) Class Intervals % 5 – 10 6.710 – 15 50.015 – 20 23.320 – 25 13.325 – 30 6.7
Histograms An appropriate histogram should have 5-15 intervals. Histograms are used when the sample sizeis moderate to large. Usen 50 as a guide. Strengths of histograms: Show theshape of the distribution. Show gaps, outliers, clusters, groupings.
Histograms – Example 2 Birth weights (g) of infants born to smoking and nonsmoking mothers Weights for Infants Born to Smokers 2557 2594 2600 2663 2665 2769 2769 2782 2821 2906 2920 2948 2948 2977 2977 2992 3005 3033 3042 3076 3076 3090 3132 3147 3203 3260 3303 3317 3321 3331 3374 3430 3444 3629 3637 3643 3651 3651 3756 3856 3884 3940 4238 709 1135 1790 1818 1885 1928 1928 1936 2084 2084 2125 2126 2187 2211 2225 2296 2296 2353 2367 2381 2381 2410 2410 2414 2424 2466 2466 2466 2495 2495 Weights for Infants Born to Nonsmokers 2523 2551 2622 2637 2637 2722 2733 2750 2750 2778 2807 2835 2835 2836 2863 2877 2877 2920 2920 2920 2977 2977 3062 3062 3062 3080 3090 3090 3100 3104 3175 3175 3203 3203 3225 3225 3232 3232 3234 3274 3274 3317 3317 3374 3402 3416 3459 3460 3473 3475 3487 3544 3600 3614 3614 3629 3651 3651 3699 3728 3770 3770 3770 3790 3799 3827 3860 3860 3884 3912 3941 3941 3969 3983 3997 3997 4054 4054 4111 4153 4167 4174 4593 4990 1021 1330 1474 1588 1588 1701 1729 1893 1899 1928 1970 2055 2055 2082 2100 2187 2240 2240 2282 2301 2325 2353 2381 2395 2438 2442 2450 2495 2495
Histograms – Example 2 Would like to compare birth weights of infants born to mother’s who smoked during pregnancy to those who did not. What distributional differences, if any, do you see?
Auckland sunshine hours, January to April, 2000 15 10 Frequency 5 0 0 5 10 15 Daily sunshine (hours) Histograms – Example 3 No outliers or gaps. Two broad groupings (one group of days with little or no sun and another group of days with between 4 to 13 hours of sun).
(a) Unimodal (b) Bimodal (c) Trimodal (d) Symmetric (e) Positively or Right skewed (long upper tail) (f) Negatively or Left skewed (long lower tail) (g) Symmetric (h) Bimodal with gap (i) Exponential shape Distributional Properties - Shape
Outlier Outlier (k) Outliers Distribution Properties - Outliers • Outliers Mistakes or something interesting/unusual.
(b) Bimodal (c) Trimodal Distributional Properties - Modality • Existence of more than one peak Modality (unimodal, bimodal, etc).
Normal distribution (d) Symmetric (f) Negatively or left skewed (long lower tail) (e) Positively or right skewed (long upper tail) Distributional Properties - Skewness • Shape of the distribution Symmetry, skewness.
Distributional Properties – Central Tendency and Variability/Spread • Central values and spread What is the central value? How spread out are values about center? Typical birth weight of infants born to nonsmokers is approx. 3000g. A majority of infants have birth weights within 500g of what is typical.
Spike (j) Spike in pattern Interpreting Stem-and-Leaf Plots and Histograms • Be suspicious of abrupt changes
Histograms – Example 4 # of Cigarettes Smoked Per Day by WSU smokers How would you characterize this distribution?
(l) Truncation plus outlier Interpreting Stem-and-Leaf Plots and Histograms • Be suspicious of abrupt changes
(a) Unimodal (b) Bimodal (c) Trimodal (d) Symmetric (e) Positively or Right skewed (long upper tail) (f) Negatively or Left skewed (long lower tail) Normal Distribution (g) Symmetric (h) Bimodal with gap (i) Exponential shape Features to look for in histograms and stem-and-leaf plots • Outliers • Existence of more than one peak • Shape of the distribution • Central values and spread • Be suspicious of abrupt changes
Spike (j) Spike in pattern Outlier Outlier (k) Outliers (l) Truncation plus outlier Features to look for in histograms and stem-and-leaf plots • Outliers • Existence of more than one peak • Shape of the distribution • Central values and spread • Be suspicious of abrupt changes
= sample mean Q1 Q3 Med Outlier Width of box represents the IQR, the interquartile range, which is the range of the middle 50% of the data Quantile and Outlier Boxplots Birth weights of babies born to smoking mothers
Quantile and Outlier Boxplots Boxplots are useful for comparing a numeric response variable across populations.