Download
1 / 15
150 likes | 283 Views
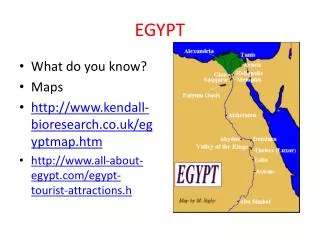
Egypt’s trade 1990-2014. Developmental effects of the liberalization of trade . Egypt recent history. Egypt between 1980-1990 Cutting subsidies for agriculture Egypt today Geo Political turmoil Economic position Trade Indicators – imports: consumer:31% intermediate :29% raw:21%

E N D
Egypt’s trade 1990-2014 Developmental effects of the liberalization of trade
Egypt recent history Egypt between 1980-1990 • Cutting subsidies for agriculture Egypt today • Geo Political turmoil • Economic position • Trade Indicators – • imports: • consumer:31% intermediate :29% raw:21% • Export: Consumer:46% Intermediate:30% Raw:20% • Exports: • Various countries-24%, US- 6.9%, Italy-7.9%, India-6.9%, Saudi Arabia-6.23%, Turkey- 5.34% • Imports: • Others 20.9%, China-9.4%, U.S- 7.6%, Germany-6.7%
TRADE AGREEMENTS • The Uruguay Round • Egypt – European Union (EU) Partnership • the Greater Arab Free Trade Area (GAFTA) • Common Market for Eastern and Southern Africa (COMESA)
Agreements results • Quota cut • Tariff reduction • Increase in trading size • change in composition of exports and imports • Change in current account
Size of export and imports • volatility • Increase in both exports and imports, but substantially more in imports
Import and Export partners • Export: EU, USA. Later: India, Saudi Arabia, Russian Federation, • Import: EU, USA, Later: China, India • Diversification in trading partners
Import and export composition • Change in import composition
Import and export composition • Change in export composition
Import and Export composition Percent of World Growth No real trend, composition of exports might be the cause for the volatility
Revealed comparative advantage Textile and vegetable show comparative advantage
Tourism • Tourists arrival rise up to the Egyptian revolution • Central component in the service sector
Energy Export and Import • Export two main sources of energy; petroleum and gas. • 1990 - 2000 refined gas resources for local consumption only. • Oil supply dwindle • During the last two decades Egypt has gone through a drastic change in the composition of its energy export, as oil export was reduced and gas export increased. • 2000 gas fields discovered • Since 1990 Egypt production of oil decreased from exporting 400,000 barrels to just about 200,000 in 2000 and almost no net exports in 2008 (http://www.irangi.org/Statistics/Egypt.pdf). • Since the early 2000’s gas exports from Egypt have been rapidly increasing, reaching 700 cubic feet of export in 2008 starting from no export at all in 2002. • Since 2010 gas export is diminishing as well, dropping to about 500 cubic feet in 2012. By 2012 Egypt has gone through a negative process that might force it to start being a net importer of energy (oil and gas).
Savings and investment • GDP fixed capital formation (GDPFCF) which explores the net investment of the government: the sum of investment (GDP not consumed) in the private and public sectors of the state. • GDPFCF is extremely volatile with no real long trends • The yearly GDPFCF rates are fluctuating widely and only seem to get more volatile with time.
Future improvements • More openness and focus on labor intensive industry in which Egypt have relative advantage • investment • Improving education and widening structure for technological improvement • Equality (GINI Index) • Corruption index2006-7- 2012-115

![IV. Various Costs of Trade and Trade Arrangements Direct and indirect costs of trade [Head, 59-90; R/H, 159-168]](https://cdn0.slideserve.com/22356/slide1-dt.jpg)