Download

1 / 4
60 likes | 247 Views
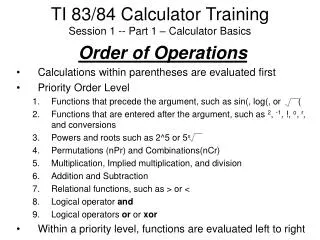
Plotting coordinates into your TI 84 Plus Calculator. Steps. 1. Find a least two points from a graph, table or two sets of coordinates and put them in a Table. (2,4) (-7, 8) 2. Place the x coordinates under L1 and y coordinates under L2. How? a) Press Stat , Enter.

E N D
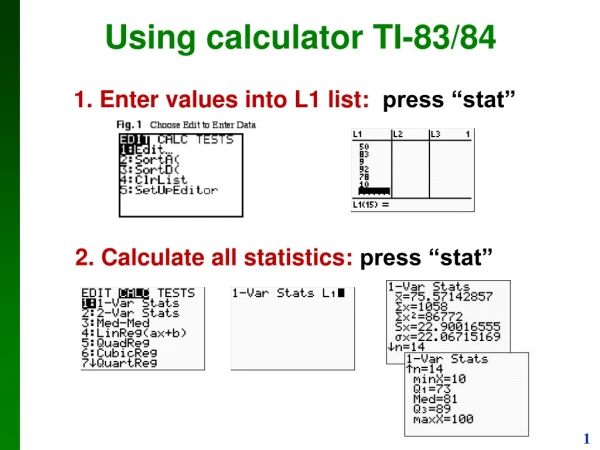
Steps 1. Find a least two points from a graph, table or two sets of coordinates and put them in a Table. (2,4) (-7, 8) 2. Place the x coordinates under L1 and y coordinates under L2. How? a) Press Stat , Enter. b) Type in x coordinates under L1, type y coordinates under L2 3. Run the linear regression by pressing Stat, then going to CALC, select 4 (LinReg) and Enter You should see
4. Plot this graph by entering the slope y intercept form How? Press Y= key Type equation and press Enter. Press Graph. Check coordinates on a Table. How? Press 2nd button and Graph
Trouble shoot Can’t see L2 for entering y coordinates. Solution: Press Stat, 5(Setup Editor), Enter.