Download
1 / 11
190 likes | 714 Views
TI- 84 Graphing Calculator. Let the “little people” do the work!. Why Use A Calculator?. Cheaper than a laptop Students learn visually and hands-on Students are engaged Students are critical thinkers Students are problem solvers

E N D
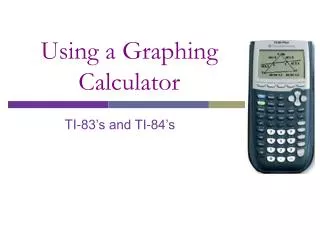
TI- 84 Graphing Calculator Let the “little people” do the work!
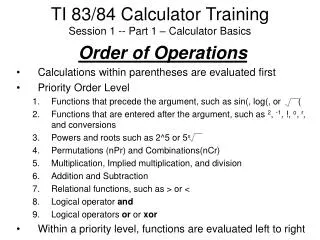
Why Use A Calculator? • Cheaper than a laptop • Students learn visually and hands-on • Students are engaged • Students are critical thinkers • Students are problem solvers • Students are 21st Century learners Why teachers use a graphing calculator?
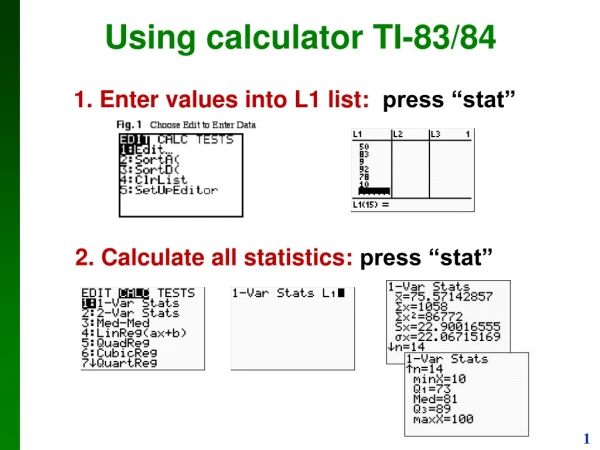
Data Collection – “More Students Apply Early” • Press Stat, Edit, Enter – Data in Lists (already completed ) • Press Stat, Enter and highlight L3 (press up arrow ^ to highlight)
Press Window and set the appropriate values for the data • Press Graph
Focus Questions • What is the average increase in the number of students that are applying early for the time period shown in our data? • What is the linear function modeling this data?
Focus Questions Continued • What does the slope and y-intercept mean in the early decision-year scenario? • Predict the total number of students applying for early decision for the period 2004 through 2007.
Focus Answers • Your scattered plot should show that 6197 students are applying for early decision • Y=5908.7857142857X +42998.357142857 slope = 5909 (increase of students/time period y-intercept = 42998 (number of students that applied early in 1997-98) Back to Questions Page
Answers Continued • The values shown below are found using the linear model. (refer to Slide #6)