Download
1 / 57
580 likes | 791 Views
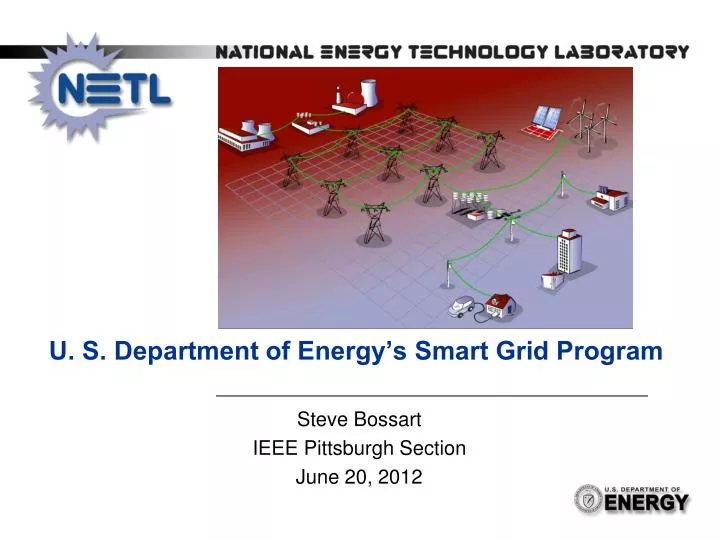
U. S. Department of Energy’s Smart Grid Program. Steve Bossart IEEE Pittsburgh Section June 20, 2012. Smart Grid Topics. Definitions & Concepts Smart Grids & Microgrids Drivers & Value Proposition Deployment Challenges Smart Grid Field Projects Metrics & Benefits Approach

E N D
U. S. Department of Energy’s Smart Grid Program Steve Bossart IEEE Pittsburgh Section June 20, 2012
Smart Grid Topics • Definitions & Concepts • Smart Grids & Microgrids • Drivers & Value Proposition • Deployment Challenges • Smart Grid Field Projects Metrics & Benefits Approach • Smart Grid Progress
What’s Different with Smart Grid • Consumer engagement with resources to solve power issues locally • Two-way power flow in Distribution • Two-way communications • Integration of Distributed generation and storage • Imperative to transform from passive to active control in Distribution • Move from radial to network Distribution system • New ways for Distribution to become a Transmission resource • Potential to transform transportation sector
Smart Grid Principal Characteristics The Smart Grid will: Enable active participation by consumers Accommodate all generation and storage options Enable new products, services and markets Provide power quality for the digital economy Optimize asset utilization and operate efficiently Anticipate & respond to system disturbances (self-heal) Operate resiliently against attack and natural disaster 5
Smart Grid Technologies • Integrated Communications
Smart Grid Key Success Factors The Smart Grid is MORE: Reliable Secure Resilient Economic Efficient Environmentally friendly Safe
Microgrid and OE’s Performance Target Definition by Microgrid Exchange Group OE’s 2020 Performance Target A microgrid is a group of interconnected loads and distributed energy resources within clearly defined electrical boundaries that acts as a single controllable entity with respect to the grid. A microgrid can connect and disconnect from the grid to enable it to operate in both grid-connected or island-mode. Develop commercial scale (<10MW) microgrid systems capable of reducing outage time of required loads by >98% at a cost comparable to non-integrated baseline solutions (UPS + diesel genset), while reducing emissions by >20% and improving system energy efficiencies by >20%
Microgrids Smart Grids Microgrid Distributed Generation E-Storage Load Central Generation Load Transmission Distribution Distributed Generation E-Storage
Why Modernize the Grid? Today’s grid is aging and outmoded Unreliability is costing consumers billions of dollars Today’s grid is vulnerable to attack and natural disaster An extended loss of today’s grid could be catastrophic to our security, economy and quality of life Today’s grid does not address the 21st century power supply challenges Adverse trends associated with the grid - Costs, reliability, peak loads, asset underutilization, TLRs, grid divorce The benefits of a modernized grid are substantial 13
Benefit of Modernization $1294 – 2028 Billion Overall benefit-to-cost ratio of 2.8 to 6.0 Value Proposition Cost to Modernize • $338-$476B over 20 years • $ 82-90B for transmission • $232-$339B for distribution • $24-46B for consumer • $17-24B per year EPRI, 2011 • Previous Studies • Benefit to Cost Ratio for West Virginia of 5:1 • Benefit to Cost Ratio for San Diego of 6:1 • Benefit to Cost Ratio for EPRI (2004) 4:1-5:1 • $165B Cost • $638 - $802B Benefits EPRI Report: http://www.smartgridinformation.info/pdf/3272_doc_1.pdf
Who are the Beneficiaries? • Utilities (What’s in it for my shareholders?) • Consumers (What’s in it for me?) • Society (What’s in it for us?) We get what we reward!
Utility Value Proposition Opportunities Rate of return Operational Benefits Outage restoration, billing, reduce T&D losses, optimize asset utilization, maintenance, planning Improved Customer Satisfaction Cost Risk of cost recovery Utilities are the engine for investment in Smart Grid
Consumer Value Proposition Opportunities More reliable service Reduce business loss Energy bill savings Transportation cost savings Information, control, options Sell resources into the market Cost “Consumer always pays” Is this compelling?
Societal Value Proposition Opportunities Downward pressure on electricity prices Improved reliability reducing consumer losses Increased grid robustness improving grid security Reduced emissions New jobs and growth in GDP Revolutionize the transportation sector Reduce import of foreign oil Cost No incremental cost? Does the societal value proposition make it compelling?
Change Management A significant change management effort is needed: • Why do we need to change? • What is the vision? • Who’s in charge? • What is the value proposition? • Consumer education, alignment, and motivation is critical • Metrics needed for accountability and to monitor progress • Active leadership by stakeholder groups needed Move at the “Speed of Value”
Technical Challenges • Interoperability and scalability • Large number of consumers actively involved • Decentralized operations with 2-way power flow • Getting the communications right • “Future proofing” the technologies • Cyber Security • Conversion of data to information to action • Market driven Where will we find the skilled resources to solve these?
Regulatory Challenges • Time-based rates • Clear cost recovery policies • Policy changes that remove disincentives to utilities • Societal benefits included in business case • Increased utility commission workload • Consistency among state utility commissions • Potential cost of “carbon management” • Future proofing vs. stranded assets • Consumer privacy concerns • Least cost • Used and useful • New operating and market models
Recovery Act – Grid Modernization • Programs created by statute • Energy Infrastructure Security Act 2007: • Smart Grid Investment Grants (Sec. 1306) • Smart Grid Regional Demonstrations (Sec.1304) • Recovery Act Directed Programs: • Workforce Training - $100M • Interconnection-wide Transmission Planning and Resource Analysis - $80M • Interoperability Standards - $12M • Additional OE initiatives • - State & Local Energy Assurance • - State Regulatory Assistance One-time Appropriation, $4.5B in ARRA funds • $620M for demonstration projects • $3.425B for deployment projects Resource Assessment & Transmission Planning Smart Grid Interoperability Standards Other Workforce Training Smart Grid Demos Investment Grants
Smart Grid ARRA Activities American Recovery and Reinvestment Act ($4.3B) • Smart Grid Investment Grants (99 projects) • $3.4 billion Federal; $4.7 billion private sector • >800 PMUs covering almost 100% of transmission • 6500 distribution automation circuits • >15 million smart meters • Smart Grid Demonstration Projects (32 projects) • $620 million Federal; $1 billion private sector • 16 storage projects • 16 regional demonstrations
Smart Grid ARRA Activities (continued) Additional ARRA Smart Grid Activities • Interoperability Framework by NIST ($10M) • Transmission Analysis and Planning ($80M) • State Electricity Regulator Assistance ($50M) • State Planning for Smart Grid Resiliency ($55M) • Workforce Development ($100M)
Technology Deployment SGIG/SGDP Areas of Smart Grid Technology Deployment Customer Systems Advance Metering Infrastructure ElectricDistribution Systems Electric Transmission Systems Equipment Manufacturing Customer Systems Customer Systems Customer Systems Customer Systems Customer Systems • Displays • Portals • Energy management • Direct load controls • Smart meters • Data management • Back office integration • Switches • Feeder optimization • Equipment monitoring • Energy Storage • Wide area monitoring and visualization • Synchrophasor Technology • Energy Storage • Energy devices • Software • Appliances
Schedule for Benefits Analysis The DOE Metrics and Benefits work is transitioning into the reporting and analysis of impact metrics. See smartgrid.gov Metrics and Benefits Plan We are here Build Metric Reporting and Analysis Impact Metric Reporting and Analysis
Key Program Objectives Key Stakeholders: Three Objectives: Advancing the Business Case Utilities NARUC and PUCs Information Derived from 131 ARRA Smart Grid Projects EEI/EPRI Sharing Lessons-Learned and Best Practices NRECA/CRN APPA NASPI Consumer Advocates • Determining R&D Needs • System Engineering • Advanced Analytics
SGIG Consumer Behavior Studies:Study Population Statistics • Total of ~145,000 customers are expected to “participate” as treatment or control customers • Plan to collect key demographic information on all treatment and control customers (ideally), subject to survey response rates • Assuming 3 years worth of hourly interval usage meter data (1 year pre-treatment and 2 years post-treatment); this represents 3.9 billion data observations • To put our SGIG analysis and evaluation effort into perspective: • ComEd’s CAP study included ~8,500 participants and ran for 12 months (June 2010 - May 2011) • CA Statewide Pricing Pilot included ~2,500 participants and ran for 18 months (July 2002 – December 2003)
SGIG Consumer Behavior Studies: Overview of Research Topics Given the diversity of studies being undertaken as part of the SGIG program, we have a unique opportunity to evaluate issues in several topical areas: Research Topical Areas • Customer Acceptance: What motivates customers to accept time-based rate programs? • Customer Retention: What motivates customers to remain on time-based rate programs? • Customer Response: Will customers respond, and if so by how much will they respond, to time-based rate programs? • Role of enabling technology and information/education: Will customers respond, and if so by how much will they respond, to control and/or information technology and/or education alone?
DOE Analytical Approach Example What does the Smart Grid do? How does it do that? What “goodness” results? What is the goodness worth? What are Smart Grid technologies? Assets Functions Mechanisms Benefits Monetary Value • Capacitor controls • Distribution Management System Automatic Voltage and VAR Control Improves feeder voltage regulation Reduced feeder losses worth $60 per MWh $6000
Five Primary Analytical Focus Areas • Operations & Maintenance Savings from Advanced Metering • Meter reading • Service changes • Outage management • Peak Demand and Electricity Consumption • Advanced metering infrastructure • Pricing programs & consumer devices • Direct load control • Distribution System Reliability • Automated & remote operations • Feeder switching Monitoring & health sensors • Energy Efficiency in Distribution Systems • Voltage optimization • Conservation voltage reduction • Line losses • Operational efficiency • Transmission System Operations & Reliability • Application of synchrophasor technology for wide area monitoring, visualization, and control
Preferences Observations Lessons Learned Recommendations Corrective Actions Best Practices Anecdotes Root Cause Compliments Complaints Surveys
Variety of Stakeholders • Electric Service Provider • Decision makers • Operations & maintenance • Planning • Engineering & design • Customer service • Traders • Purchasing • Regulatory support • Billing
SGIG Deployment Status 9.3 of 15.5 million residential and commercial smart meters Distribution automation equipment on 4,200 out of 6,500 circuits 195 out of over 800 networked phasor measurement units
Status of Smart Grid Investments in SGIG Program
Automated Distribution Circuits in SGIG There are approximately 81,200 distribution circuits in US 6,500 circuits is about 8% of total distribution circuits
Customers with Smart Meters Enrolled in Pricing Programs in SGIG
eEnergy Vermont A State-Wide Strategy for Smart Grid Development Utilities working together to modernize the grid. • Key Activities • Smart metering roll-out for outage management and time-based rates for demand response. • Distribution system automation including switches, reclosers, SCADA, and communications backbone systems. • Consumer behavior studies by Vermont Electric Cooperative (VEC)and Central Vermont Public Service to assess customer acceptance, response, and retention. • Aims and Strategies • A collaborative effort involving all of the state’s electric distribution companies to modernize Vermont’s electric grid and foster economic growth as part of the state’s “eState Initiative” with telecommunications and health care. • Results and Benefits • VEC’s outage management system has improved SAIFI by 50% and CAIDI by 40% since installed in 2008. • VEC’s smart metering roll-out and outage management system has a 5 year payback period from operational saving alone. • VEC received POWER Magazine’s first “Smart Grid Award” in August 2011 for its pioneering efforts in outage management. • Restoration of the grid from Tropical storm Irene occurred quicker and with greater customer awareness of repair schedules due to smart meters, web portals, and more effective outage management. Vermont Electric Cooperative’s Smart Grid Operations Center Facts & Figures Total Project Budget: $137,857,302 Federal Share: $69,928,650 Distribution Automation: 47 circuits and substations Smart meters: 311,380 Time-Based Rates: 1,500 customers targeted