Download
1 / 31
310 likes | 437 Views
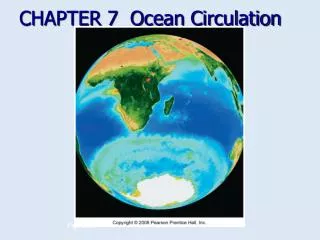
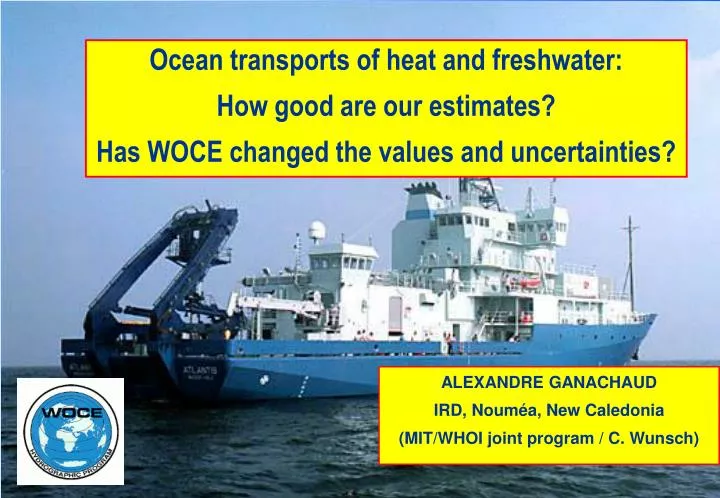
Ocean transports of heat and freshwater: How good are our estimates? Has WOCE changed the values and uncertainties?. ALEXANDRE GANACHAUD IRD, Noum é a , New Caledonia ( MIT/WHOI joint program / C. Wunsch). Ocean-atmosphere heat transports. 1PW=10 15 W = 10 6 nuclear plant. latitude.

E N D
Ocean transports of heat and freshwater:How good are our estimates?Has WOCE changed the values and uncertainties? ALEXANDRE GANACHAUD IRD, Nouméa, New Caledonia (MIT/WHOI joint program / C. Wunsch)
Ocean-atmosphere heat transports • 1PW=1015W • =106 nuclear plant latitude Keith (1995)
Heat transports 3 and more methods Hydrographic method Freshwater transports 3 and more methods Hydrographic method Outline Uncertainties What did WOCE bring? Future ?
Observation density Josey et al. 1998 Josey et al: systematic error of 30 W m-2=10PW globally Heat flux estimationMethod 1 « BULK » • Data from voluntary observing ships and buoys • Empirical formulae: • da Silva (1945-1989) • SOC (1980-1993) • Uncertainties: • Measurement accuracies: 15 W m-2 • Formula is not universal • Uneven spatial coverage
Earth Radiation Budget Experiment (ERBE) Ocean Trenberth and Caron, 2001 Heat flux estimationMethod 2: « atmospheric residuals » Atmosphere: NCEP • High resolution products • Depends on atmospheric (data-assimilating) model and internal parameterizations • Uncertainties not possible to compute
WOCE (1990-1995)World Ocean Circulation Experiment • Goal 1: to develop models useful for predicting climate change and to collect the data necessary to test them • Objective 1: to determine and understand the global large-scale fluxes of heat and freshwater; their divergence over 5 years and their annual and interannual variability • Net air-sea fluxes between sections with uncertainties • T, S, oxygen,nutrients; moored arrays;XBT, ADCP; floats;repeat sections
Method 3:Hydrographic method • Geostrophic advection • Ekman Transport z v Absolute velocity Reference velocity Relative thermal wind b(x) NCEP reanalysis Correction WOCE subset of Ganachaud & Wunsch
Constraints • Conservation • mass • salt • heat (deep) • silicate (top-bottom) • 170PO4+O2(deep) • Net fluxes • straits (Florida…) • WBC (arrays) • topography / ridges • Reference surfaces • Current meters, water mass and previous works
n1 n2 nT nS nf Mass layer 1 Mass layer 2 Mass surf/fond Silicate surf/fond Florida Strait 0 0 0 0 31 + = Linear model Gauss-Markov estimator 1200 constraints 3000 unknowns b(x) =0±1cm/s w*(z) =0 ± 10-4 cm/s *(z) =0 ± 100 cm2/s Tekman= ± 50% Freshwater = 0 ± 1Sv b= Ekman Thermal wind unknowns
Absolute velocity field Indian Ocean, 18S
Water mass transports 1Sv=106m3s-1 • NADW: 15±2 to 23±3 Sv • AABW: 6±1 Sv • CDW Indian: 11±4 • CDW Pacific: 7±2 • CDW formation: 21 ±6 Sv • ITF : 16±5 Sv
-0.4±0.2 0.7±0.2 -0.5±0.1 -0.6±0.1 1.5 1 PW 0.5 0 50S 0 50N Fu, 1981 bulk reanalysis Atlantic Heat transport • Coherent hydrographic estimates • Divergences=air-sea fluxes • NCEP-ERBE air-sea flux consistent with GW within 0.1 PW • No uncertainties on climatologies • Adjustment at 6°N hydrography
Indian + Pacific • Less data • Up to 1PW differences in climatologies due to low southern coverage.
Air-sea fluxes Global heat fluxes • Southern-0.7PW / Tropical+2.3PW / Northern -1.7PW • 70% of the global cooling takes place in the North • Flux products and ocean numerical models are getting closer to hydrographic estimates
Ergodic hypothesis: Large scale circulation = time mean Measurement noise Calculations To which extent can one section sample time-mean T,S ? Quantification on numerical ocean model Repeat sections Internal waves (Garrett-Munk) Experiments (bottom triangles, gaps…) ±5 Sv ±3 Sv ±1 Sv Uncertainties
Seasonal bias in hydrographic sections WOCE number of months-at-sea At mid and subtropical latitudes (year shifted by 6 months in the Southern Hemisphere)
Precipitation Difficult observation: sporadic and orographic effects (islands) Satellite radiometers (SSM/I, TOVS):liquid and ice water content. Difficult relation with precipitations, lack of calibration Atmospheric operational models:-few oceanic observations-cloud parameterization River runoff: uncertain and unknown groundwater transports Adler et al. (2001): 2-fold changes from one quasi-standard product to the next Part II: Freshwater(>80% of greenhouse effect) Evaporation (all empirical formulae) • Bulk: local (v, q, T). Variable conditions, systematic biases • Satellite radiometers • Operational atmospheric models Large and Nurser (2001)
Large and Nurser Existing products Pacific Ocean • Wijffels, 2001: Comparison of 13 products: deviations largely exceeding the signal • Need for large scale integrals for reference and calibration
Mass divergence between two sections Signal: FW0.3 Sv (0.3 106 m3s-1) Residual mass noise: nM=±7Sv Use of mass and salt correlation: Noise in the differencen ’M ±0.2 Sv(Wijffels, 2001) Freshwater transports from hydrographic data
Ganachaud Wunsch Dai and Trenberth Freshwater transports across hydrographic lines • Significant over large areas: • Globally (GW): 30°S - 47°N: E=1.2±0.5 Sv • Southern Ocean: P=0.8±0.9 Sv • Too much evaporation in satellites • Most other products within large uncertainties From Wijffels (2001) ATLANTIC Zero FW ITF PACIFIC INDIAN
Much remains to be done with WOCE data: evaluation of uncertainties from OGCM simulation More in-situ measurements: VOS radars ?* Tomczak, 2002 In conclusion ? 0
NET OVERTURNING HORIZONTAL Talley’s decomposition UPPER INDIAN OCEAN ENERGY TRANSPORT AT 8S NET: -0.7 PW Transport processes1. Steady / instantaneous • Heat is transported by the overturning term in density coordinate • Freshwater is transported by overturning and horizontal; a 2-D model would be wrong
Roemmich & Gilson * (XBT, 2001): rectified eddy transports (v’T’) may reach 30% of the mean in the North Pacific Time (6.5 years) Longitude at 24N Transport processes2. Rectified time variability
1976-77 1976 1967 1965 1967 1971 Before WOCE (Wunsch, 2001) Year of publication 82 84 85 85 91 93 94 96 00 00 00 00 01 01 02 Publication year 32 S Indo-Pacific heat transport Ocean transport of heat and Freshwater Has WOCE changed values and uncertainties? • New data: • Unprecedented coverage* withbroad accessibility; more studies from varied methods • Higher resolution, supplementary data • More bulk and satellite observations • New results: • Higher quality estimate, better control of uncertainties (model error) • Reduction of uncertainties difficult to quantify from the litterature • In repeat sections no significant changes (*) • Stimulation of flux products; ocean and climate GCM • Subpolar Cooling (24-47N): 1.1±0.2PW=32 ±6Wm-2 • Bulk: global bias +30Wm-2 • Reanalyses: ? (rms 30Wm-2 for 500km scales) • Freshwater fluxes: bounds on large scale values: 1.2 ±0.5 Sv net tropical evaporation How good are our estimates ?
Sato and Rossby (2000) Will we be able to detect transport changes? Year of publication
Remaining uncertainties Indonesian Throughflow Variability (nutrients) -> repeat observations Error behavior: experiments on GCMs Winds Possible further work Increasing resolution * Global combination of regional studies Perspectives 1improvements
Optimizing the signal Perspectives 2future hydrographic lines
Grist & Josey (2002) Bulk,constrained climatology Perspective 3Constraining flux products constraint
Other applications of WOCE hydrographic program Biogeochemical cycles: Oxygen and nutrients transports, diagnostics of sources and sinks, quantification of export production
Thanks To Inspired from H. Bryden, S. Imawaki and S. Wijffels Ocean Circulation and Climate • Macdonald • S. Josey • J. Marotzke • H. Bryden • C. Wunsch • K. Trenberth • … and many other WOCE actors !
Fu, 1981 Atlantic Ocean • Coherent hydrographic estimates • Divergences=air-sea fluxes • NCEP-ERBE air-sea flux consistent with GW within 0.1 PW • No uncertainties on climatologies • Adjustment at 6°N hydrography bulk reanalysis