Download
1 / 17
200 likes | 372 Views
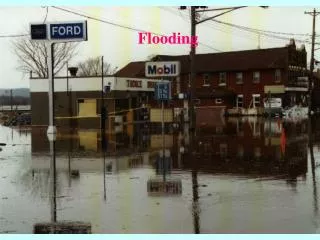
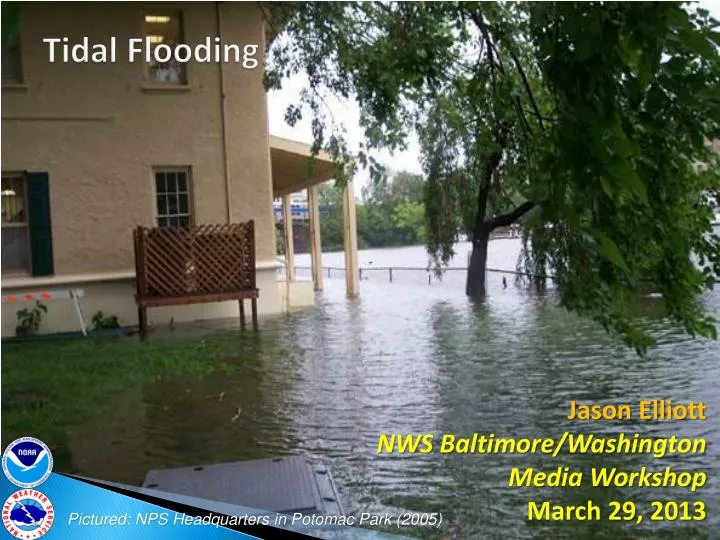
Tidal Flooding. Jason Elliott NWS Baltimore/Washington Media Workshop March 29, 2013. Pictured: NPS Headquarters in Potomac Park (2005). Tidal Flooding. Easy to understand… …if only it was really this easy!. Tides love to misbehave…. Winds can greatly affect tides…even without a “storm”.

E N D
Tidal Flooding Jason Elliott NWS Baltimore/WashingtonMedia WorkshopMarch 29, 2013 Pictured: NPS Headquarters in Potomac Park (2005)
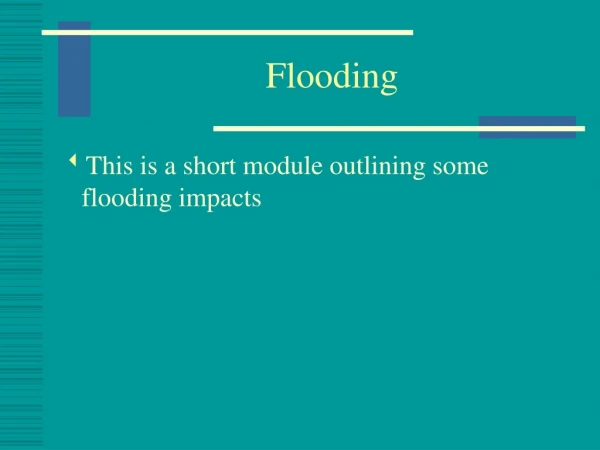
Tidal Flooding • Easy to understand… • …if only it was really this easy!
Tides love to misbehave… • Winds can greatly affect tides…even without a “storm”. • The shape of bays/inlets/etc. can also funnel or channel water. • Worst of all…it’s a “game of inches”. • On some days, tide levels only a few inches above the astronomical prediction are enough to produce inundation.
Tidal Floods – Tropical Storms / Nor’easters • Tropical cyclones:Favorable if stormmoves west of DC • Most favorable ifstorm moves westof mouth of Ches.Bay and DC
Tidal Floods – Tropical Storms /Nor’Easters • If the center of thestorm stays eastof DC, impacts willbe lessened • If the center of thestorm stays eastof the Bay and DC,impacts will bevery little • Still some minoreffects, and watchfor freshwater!!
So what happened in Sandy? • Was it favorable orunfavorable? Actually, both!
Phase 1: The Drop • Due to the movement of the storm, tides actually dropped significantly as the storm approached. Astronomical Tide MinorFloodLevel
Phase 2: The Surge • But as the low center passed us to the north, a significant surge of water came in, causing flooding. Mod.Flood L MinorFloodLevel
Phase 3: The Freshwater • Freshwater inundation then followed from upstream rains above thefall line. pre-stormblowout TidalSurge MinorFresh-waterinfluence
Freshwater Inundation of Tidal Zones • 1942 Freshwater vs. 1933 HurricaneAll heights in common tidal datum (low water datum) except Little Falls (which is non-tidal) * For comparison, Isabel (2003) was 11.2 feet atWisconsin Avenue
How far can the freshwater go? • You might be surprised! This map shows the extentof where freshwater wouldcreate ½ foot rises or morein the Tidal Potomac, basedon NWS modeling. = 10 ft at Little Falls = 12 ft at Little Falls = 14 ft at Little Falls = 28.1 ft at Little Falls
NWS Coastal/Tidal Flood Products • Minor tidal flooding happens frequently (usually at least once per month). • This minor tidal flooding is not a concern for most people. • On the Potomac River, river flood products stop at Little Falls. Below Chain Bridge, coastal flood products take over…even for freshwater inundation. NWS BulletinsCoastal Flood Advisory – keep an eye on things but effects expected to be limited to nuisance flooding (low-lying Old Town Alexandria, East Potomac Park, etc.) Coastal Flood Watch or Warning – Need to take notice, could/will be significant 20-50 timesper year 1-5 timesper year
New Forecast Information Available • Forecast model was developed for the uppermost Tidal Potomac (Washington DC). • Key limitation: This model cannot account for significant wind. • Second key limitation: The ocean model must pick up on a wind-based tidal increase before the Potomac model will see it. Potomac River/Washington Channel Forecasts Little Falls Wisconsin Avenue SW Waterfront
Model Output Available • Chesapeake Bay Operational Forecast System Blue = ObservedYellow = Astro. Red = CBOFS http://tidesandcurrents.noaa.gov/ofs/cbofs/cbofs.html
Model Output Available • Key point: CBOFS or the Upper Potomac model showing conditions that reach minor/moderate flood and our issuance of coastal flood products are not always coincident. Model output is still just guidance!
Final Notes • It doesn’t take a tropical storm / Nor’easter to produce coastal flooding – even moderate-level flooding. • Although the Potomac is the most visible example, freshwater inundation affects other areas too. Sediment spreads down the Susquehanna, Potomac, and Rappahannock tidal zones after Lee (2011).
Questions? Jason ElliottSenior Service HydrologistNWS Baltimore/Washingtonjason.elliott@noaa.gov Search “US NationalWeather Service Baltimore/Washington” Visit us online: weather.gov/washington