Download
1 / 57
570 likes | 675 Views
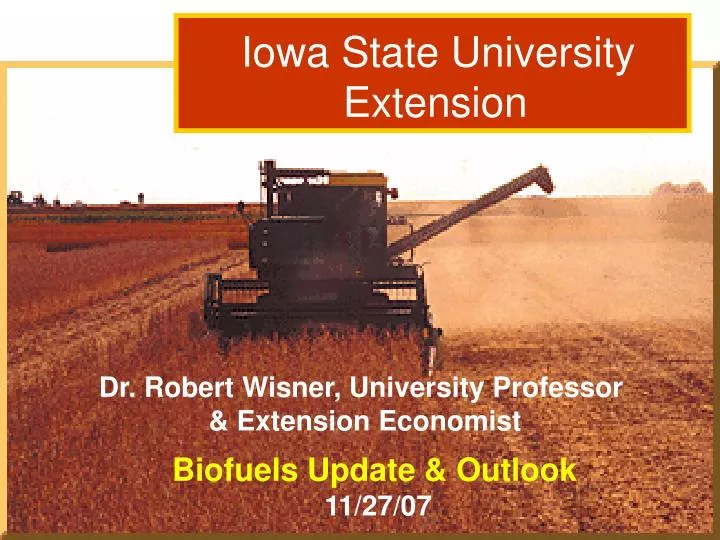
Iowa State University . Extension. Dr. Robert Wisner, University Professor & Extension Economist. Dr. Robert Wisner: Grain Outlook 3/15/06. Biofuels Update & Outlook 11/27/07. Global Biofuels Developments. Dramatic changes emerging in global Ag Rapid expansion-- in U.S., Brazil, EU

E N D
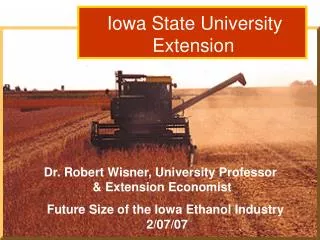
Iowa State University Extension Dr. Robert Wisner, University Professor & Extension Economist Dr. Robert Wisner: Grain Outlook 3/15/06 Biofuels Update & Outlook 11/27/07
Global Biofuels Developments • Dramatic changes emerging in global Ag • Rapid expansion-- in U.S., Brazil, EU • About 90% of Global Ethanol -- from U.S., Brazil • EU leading in biodiesel use • Rapid growth of palm oil production for biodiesel • Major constraint: cropland availability • Global forces will determine size of industry
41 countries encourage biofuelsMajor Countries with Ethanol Fuels • U.S. • Brazil • Canada • China • EU-27 • Thailand Countries considering ethanol fuels • South Africa • Ukraine • Japan, others
Major Countries with Ethanol Fuels • U.S. – likely production of 14-15 bil. gal. from corn in 4.5 to 5.5 years • Brazil current 5.34 bil gal. –89 new ethanol plants to be built, 2007-2011 (51 under construction) • 2% biodiesel mandate by 2008 & 5% by 2013 • China – 3 corn-based plants, emphasis shifting to other feedstocks (9 mil. T. maize for ethanol)
Major Countries with Ethanol Fuels, cont. • EU-27 – 5.75% of motor fuel to be renewable by 2010, 10% in 2020 • Canada – 5% ethanol mandate by 2010, 2% biodiesel by 2012 • Thailand – ethanol from sugar, casava Biodiesel– Competition for crop land
China Ethanol Policy • No more grain-based ethanol plants • Emphasis on root crops • Operating pilot cellulose plant • Interest in biodiesel from palm oil
Battle for acreage: S. Am., EU, U.S. wheat, SB, Cotton, & Corn: Key Influences Ethanol profitability --Infrastructure & transportation -- Negative margins ahead -- how long & how bad? Govt. biofuels mandates? Strong Corn Export sales World Economy? EU opening up 10% set-aside in 2008 Basis behavior, spring & summer
Market OverviewR. Wisner, ISU Econ. Corn Supplies fully adequate for demand --Slower domestic feed demand -- Slowing ethanol growth -- Sizeable increase in carryover likely in 08 SB supplies tightening -- How tight depends on S. America -- More 5-6 mil. More SB acres needed next spring 3. Price prospects, cash corn prices: -- steady to modestly higher into mid-winter. Down-side risk in summer Price prospects, cash SB: --higher trend into mid-winter, high volatility, summer risk.
2.36 11/15/07 1.92 11/25/07 HOI E-85 1.63 0.35 0.185 0.20 0.434 0.059 $2.00
Monthly CRB Index Incentive for Index Fund Traders to buy Commodities for inflation hedge
Weekly U.S. Dollar Index: Reduces grain prices in world markets
International Impacts • U.S. ethanol plants under construction to use 55 mil. tons of corn (doubling use) • 3.5 times the volume of Japan imports of U.S. corn • 123% of 2006 EU corn crop • 66% of global corn exports • Other countries are expanding ethanol & biodiesel • Strong negative impacts on animal ag. • Higher food costs ahead • Major risk-management challenges in Ag. & bioenergy
(Growth 2007-12 = 147% of U.S. soybean oil exports) (Food demand for vegetable oil highly inelastic) Pulls land away from food uses Source: FAPRI estimates
Figure 3. Total 11,693 mil. Bu.
Demand Curve for Ethanol Price Renewable Fuel Standards/Oxygenation • But at expense of: • Octane Enhancement Motor Fuel Use 73-75% of gasoline @ E-85 Source: Dr. Matthew Roberts, Ohio State University • Quantity 29
2007-08 U.S. corn supplies adequate to meet demand • Crop up 25%, 20% increase in corn acres • But at expense of: • 16% decline in soybean planted area • 29% decline in cotton area • 8% decline in non-durum spring wheat • Declines in other minor crops • Soybean supplies to tighten substantially, increased plantings needed in 2008 • Cotton more needed in 2008 • More U.S. corn likely will be needed in 2009
Changes in Ethanol Plants, 7/27 to 11/06/07 (From DTN)Expansion hasn’t stopped 7/27/0711/06/07 • U.S. Operating Plants 134 139 • U.S. Plants Under Const. 89 91 • Planned plants 329 343
Figure 2. 72 Potential Iowa Plants 11 Just across IA Borders Capacity: 159% of 2006 Crop Iowa Corn Processing Plants, Current & Planned, 7/25/07
Basis Impacts from Ethanol • Iowa regional price surface shifting • Large local variability at point in time • Increased variability over time • A few key peaks in price surface, more to come • Top bidders: processors & feed mills • Large response to short crops • Biofuels mandates a potential factor
Garner Kebler Milling Hobartan Global Lakota (ethanol) Algona Emmetsburg - Ethanol Range Harv. DelivryJuly Delvry 3.18 (-.55) 3.66 (-.42) 3.41 (-.32) 3.86 (-.22) 3.29 (-.44) 3.80 (-.28) 3.28 (-.45) 3.73 (-.35) 3.20 (-.53) 3.66 (-.42) 3.33 (-.40) 3.78 (-.30) .23 .20 N.C. Iowa Basis Examples, Corn 9/28/07
Rock Rapids elevator Ashton ethanol Siouxland Energy Albert City Alton Terminal Orange City elevator Sheldon Visser Elevtr Sioux Cntr. Egg Center, Sioux Cntr. Farmers Coop. Sanborn Range Implications for farm storage economics? Harv. DelivryJuly Delvry 3.41 (-.32) 3.77 (-.31) 3.40 (-.33) 3.80 (-.28) 3.51 (-.22) 3.84 (-.24) 3.30 (-.43) 3.78 (-.28) 3.44 (-.29) 3. 81 (-.27) 3.44 (-.29) 3.81 (-.27) 3.44 (-.29) 3.81 (-.27) 3.48 (-.30) N.A. 3.51 (-.27) N.A. 3.48 (-.30) 3.80 (-.28) .21 .07 N.W. Iowa Basis Examples, Corn 9/28/07
Coon Rapids ethanol Denison ethanol Creston Elevator Corning ethanol plant Bunge, Council Bluffs Onawa Lamoni Shenandoah eth. plant Range Harv. DelivryJuly Delvry 3.27 (-.46) 3.74 (-.34) 3.51 (-.22) 3.84 (-.24) 3.30 (-.41) 3.78 (-.28) 3.32 (-.41) 3.85 (-.23) 3.29 (-.44) est. 3.75 (-.33) 3.43 (-.35) N.A. 3.18 (-.53) N.A. 3.49 (-.24) 3.95 (-.13) .33 .21 W.C. & Sw. Iowa Basis Examples, Corn 9/28/07
USDA Proj. 10/12/07 U.S. R-O-W