Download
1 / 58
620 likes | 802 Views
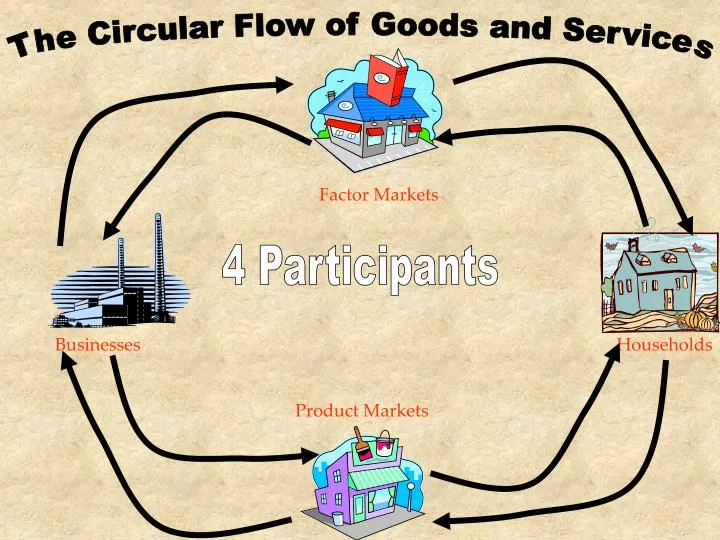
The Circular Flow of Goods and Services. Factor Markets. 4 Participants. Businesses. Households. Product Markets. The Law of Demand. Other things being equal*, as price increases, the corresponding quantity demanded falls. (*price is the only variable that is changed).

E N D
The Circular Flow of Goods and Services Factor Markets 4 Participants Businesses Households Product Markets
The Law of Demand Other things being equal*, as price increases, the corresponding quantity demanded falls (*price is the only variable that is changed)
The Demand Schedule Selling Quantity PriceDemanded 10 $ 5 $ 4 15 25 $ 3 $ 2 40 $ 1 60
The Demand Curve Graphing: -Plot the points Price -Connect the dots $6 $5 Downsloping left to right $4 $3 Demand Demand $2 $1 0 10 20 30 40 60 50 Quantity
The Law of Supply Other things being equal*, as price increases, producers will be willing to supply more (*price is the only variable that is changed)
The Supply Schedule Selling Quantity PriceSupplied 60 $ 5 $ 4 40 25 $ 3 $ 2 15 $ 1 10
The Supply Curve Graphing: -Plot the points Price -Connect the dots $6 Upsloping right $5 to left $4 $3 Supply $2 $1 0 10 20 30 40 60 50 Quantity
Equilibrium Where it is possible for buyers and sellers to realize their choices simultaneously
The Demand and Supply Schedules Selling Quantity PriceDemanded Supplied 60 $ 5 10 40 $ 4 15 25 25 $ 3 $ 3 25 25 15 $ 2 40 10 $ 1 60
Together!! Graphing: -Plot Demand Price -Plot Supply $6 D S $5 $4 $3 $2 D $1 S 0 10 20 30 40 60 50 Quantity
Changes in Demand Movement OF the curve Caused by a Change in a Determinant Selling Quantity Price Old New Inc Dec 1 $ 6 0 0 1 2 $ 5 3 $ 4 2 1 2 3 $ 3 4 3 $ 2 4 5 4 6 $ 1 5 6 $ 0 7 5
Graphing Changes Increase in Demandshifts out or to the right Price $6 $5 $4 $3 $2 $1 Old 0 1 2 3 4 6 5 Decrease in Demandshifts in or to the left Quantity
Shifting the Demand Curve Why the curve shifts 1 Consumer Tastes 2 Price of Other Goods Consumer Incomes 3 Number of Consumers 4 5 Consumer Expectations
The Determinants of Demand Or why the curve shifts Consumer Tastes 1 -beanie hats make a comeback Demand increases -Hula Hoops go out of style Demand decreases
The Determinants of Demand Price of Other Goods 2 If airlines cut ticket prices More demand for Luggage Less demand for train tickets
Tickets and Luggage are compliments Compliments are consumed or used together (inverse relationship) If ticket prices decrease, demand for Luggage increases If ticket prices increase, demand for Luggage decreases Airlines and Trains are Substitutes Substitutes replace each other (direct relationship) If air tickets decrease, demand for Train tickets also decreases If air tickets increase, demand for Train tickets also increases
The Determinants of Demand 3 Consumer Incomes +tax cuts increase net incomes Consumers have more money to spend, demand increases -the $ depreciates against the Euro Imported goods from Europe cost more dollars, demand decreases For Normal Goods!!! For Normal Goods!!!
The Determinants of Demand For Inferior Goods +tax cuts increase net incomes Consumers switch to better goods, demand for Hot Dogs decreases -the $ depreciates against the Euro Domestic travel looks better, demand increases
The Determinants of Demand Number of Consumers (also Demographics) 4 -Hurricanes arrive on Labor Day weekend Fewer tourists touring, demand decreases +NAFTA North American Free Trade Agreement Canada sells to 290 million US consumers, demand for their goods increases
The Determinants of Demand 5 Consumer Expectations -dealers reduce car prices in August Car buyers wait, demand decreases -heavy rains have damaged coffee crop Consumers expect shortages and higher prices so they buy more now, demand increases
New Equilibrium Shifting the Demand Curve Caused by a change in a Determinant of Demand Price $6 $5 P Q Supply P2 $4 decrease P1 Current Equilibrium $3 P3 increase $2 P Q Demand $1 Q3 Q1 Q2 Quantity 1 2 3 4 6 5 0
Shifting the Demand Curve Why the curve shifts 1 Consumer Tastes 2 Price of Other Goods Consumer Incomes 3 Number of Consumers 4 5 Consumer Expectations
a. Changes in Quantity Demanded or b. Changes in Demand? Consumer Incomes rise more jewelry is purchased.
The Barber raises the price of haircuts and he loses business
Price of Toyotas goes up sales of Chevrolets increase
Changes in Supply Movement OF the curve Caused by a Change in a Determinant Selling Quantity Supplied Price Old New Inc Dec 7 5 $ 6 6 5 6 4 $ 5 5 $ 4 4 3 2 3 $ 3 4 1 $ 2 2 3 2 $ 1 1 0
Graphing Changes Increase in Supplyshifts out or to the right Price $6 $5 $4 Old $3 $2 Decrease in Supply shifts in or to the left $1 0 1 2 3 4 6 5 Quantity
Shifting the Supply Curve Why the curve shifts Resource Prices 1 2 Changes in Technology 3 Prices of other goods 4 Taxes and Subsidies 5 Number of Producers
The Determinants of Supply Or why the curve shifts Resource Prices 1 -gas is discovered under CVCC Supply increases -Minimum wage goes up Supply decreases
The Determinants of Supply 2 Changes in Technology + If a more powerful computer is developed Makes production easier (and cheaper) - If stronger pollution controls are required Makes production harder (and costly)
The Determinants of Supply 3 Elements of Nature/Prices of other goods Shift resources away from high production cost goods. Caused by natural disasters or market price of other goods
The Determinants of Supply 4 Taxes and Subsidies - taxes discourage production + subsidies encourage production
The Determinants of Supply 5 Number of Producers +more firms increase supply -fewer firms decrease supply
The Determinants of Supply 6 Producer Expectations about prices and resource availability -if prices are expected to increase, more production -if prices are expected to decrease, less production
Shifting the Supply Curve Why the curve shifts Resource Prices 1 2 Changes in Technology 3 Prices of other goods 4 Taxes and Subsidies 5 Number of Producers 6 Producer Expectations
Changes in Quantity Demanded Movement ALONG the curve Consumers responding to a Change in the Price of the good Caused by factors related to production of the good Price The Supply Schedule!! $6 Harder or costlier to produce, price goes up $5 Supply Curve decrease P2 P Q $4 increase P1 Current Price $3 What makes the Supply Curve Shift?? What makes the Supply Curve Shift?? P3 $2 P Q $1 Demand Easier or less expensive to produce, price goes down Q2 Q1 Q3 Quantity 0 1 2 3 4 6 5
New Equilibrium Shifting the Supply Curve Caused by a change in a Determinant of Supply Price $6 Supply $5 decrease P2 P Q $4 increase P1 Current Equilibrium $3 P3 $2 P Q $1 Demand Q2 Q1 Q3 Quantity 0 1 2 3 4 6 5
Changes in Quantity Supplied Movement ALONG the curve Response to a Change in the Price of the good Caused by factors related to consumers Price $6 $5 P2 $4 Supply P1 Current Price $3 P3 $2 $1 Q2 Q1 Q3 Quantity 1 2 3 4 6 5 0
a. Changes in Quantity Supplied or b. Changes in Supply? Production costs decline dealer sells more cars.
Fewer oranges offered because the price has dropped
The government doubles the excise tax on liquor
S2 S2 S1 Resource Prices, and Product Markets • A reduction in the supply of unskilled labor … pushes the wage rates of fast-food workers upward. • Higher wages cause a reduction in supply. This leads to higher hamburger prices. ResourcesMarket ProductMarket Price(wage) Price S1 $2.25 $7.50 $2.00 $6.25 DR DP Quantity Employment Q1 Q2 E2 E1
Borrowing Lending D2 2. Increase in the Demand for Loanable Funds Interestrate • At the interest rate r the quantity of loanable funds demanded by borrowers into equals quantity supplied by lenders. S • An increase in demand will move D1 to D2 r2 the interest rises to r2and increasing borrowing to Q2 r1 • Higher interest rates encourage additional savings, making it possible to fund more borrowing. D1 Quantity of loanable funds Q1 Q2
U.S. sales toGuatemala D2 U.S. purchasesfrom Guatemala 3. Increase in the Demand for Foreign Exchange Exchange rate($ per quetzal) • Begin in equilibrium, where the dollar price of the quetzal is $.10 (10 cents = 1quetzal). S • Anincrease inAmericandemandfor Guatemalan coffee will also increase the demand for quetzals (with which American importers pay Guatemalan coffee growers). 0.20 0.10 • Equilibrium occurs where the new demand D2 just equals the supply S • – at $.20 per quetzal with Q2>Q1 quetzals clearing the market. D1 Quantity of quetzal exchange Q1 Q2
1. Price Ceilings • Price ceiling is a legally established maximum price that sellers may charge. • It stops the price from rising to the equilibrium level. • Example: rent control • The direct effect of a price ceiling is a shortage: quantity demanded exceeds quantity supplied.
Price ceiling Shortage The Impact of a Price Ceiling Price(rent) Rental housing market S • In the rental housingmarketthe price (rent) P0wouldbring the quantity of rental units demanded into balance with the quantity supplied. P0 • A price ceilinglike P1sets a price below equilibrium … P1 quantity demanded QD … exceeds quantity supplied QS … resulting in a shortage. D Quantity of housing units QS QD
2. Price Floors • Price flooris a legally established minimum price that buyers must pay. • It stops the price from dropping down to equilibrium level. • Example: minimum wage • The direct effect of a price floor above the equilibrium price is a surplus: quantity supplied exceeds quantity demanded.
Surplus Price floor The Impact of a Price Floor Price S • A price floorlike P1 imposes a price above market equilibrium … P1 causing quantity supplied QD … to exceed quantity demanded QS … P0 results in a surplus. • Because prices are not allowed to direct the market to equilibrium, non-price elements of exchange will become more important in determining where scarce goods go. D Quantity QD QS