Download
1 / 33
330 likes | 503 Views
Calculate, map and used of critical loads and exceedances for acidity and nitrogen in Europe. Professor Harald Sverdrup Chemical Engineering, Lund University, Sweden. Harald.Sverdrup@chemeng.lth.se. The European game plan. An effect-based methodology. Defining the critical load.

E N D
Calculate, map and used of critical loads and exceedances for acidity and nitrogen in Europe Professor Harald Sverdrup Chemical Engineering, Lund University, Sweden Harald.Sverdrup@chemeng.lth.se
Defining the critical load • The maximum amount of pollution into an ecosystem that does not cause significant damage to system resources, survival, structure or function
The critical load Contributions to neutralization in the system Contributions to acidity in the system
Norway spruce: BC/Al=1.2 Scots pine: BC/Al=1.0 Birch: BC/Al= 0.8 Beech, Oak: BC/Al==0.6 Response was measured
Models available for critical loads for acidity and nitrogen • Empirical models • Skokloster model • Empirical nitrogen critical loads • Simplified models • Simple mass balance (SMB) • F-factor models (lakes) • Integrated steady state models • PROFILE model • Integrated dynamic models • VSD model (soils) • MAGIC model family (lakes) • SAFE/ForSAFE-VEG model family (terrestial ecosystems)
The order of the actions • Static approach first - Simple mass balance models - Complex approach; PROFILE - Create critical loads maps • Apply dynamic models at sites with enough data - Single sites - qualitative assessments - Generate regional approach - representative information capture and transformation
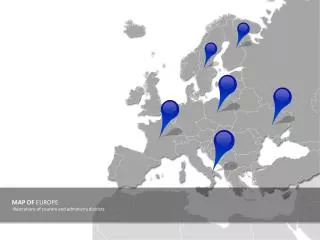
Critical loads for ecosystems in Europe, forests, open land and lakes
Exceedance depend on the receptor chosen Medel: 37 mekv/m2/år
Sulfur deposition 1980-2010 • Green = 3-6 kg S/ha yr • Red > 25 kg S/ha yr
Exceedance of critical loads • Blue < 3 kg S/ha yr • Red > 25 kg S/ha yr
Countries now into integrated regional dynamic modelling 13 NFCs submitted Dynamic Modelling outputs: Austria, Bulgaria, Switzerland, Czech Republic, Germany, France, Great Britain, Ireland, Italy, Norway, Luxembourg, Poland, Sweden.
What are the model predictions? • Recovery does not reverse the path of acidification • Fast effect initially, very slow final recovery • Recovery is not 100%
Simple messages to policy? • Critical load (CL) • No significant harmful effects if deposition don’t exceed CL • Target load (TL) • Recovery by specified year if deposition don’t exceed TL
Interpretation of target loads Will not recover by 2030 Will recover by 2030
20 years with critical loads • 1968 Acidification put on the official agenda by Prof Svante Oden in Uppsala • 1979 Convention on long range transboundary air pollution • 1985 First Olso protocol on flat rate 30% sulfur emission reduction • 1990 The second Oslo protocol, effects based but settling on 60% sulfur emission reduction • 1999 The Göteborg protocol, effects based settling for -85% S/-30% NOx • 2010 revision of the Göteborg effects based protocol
Conclusions International efforts to prevent acidification have been very successful Critical oads very extremely successful in linking environmental goals through science to policy Acidification remains as a large and significant problem in large areas of Europe