Download
1 / 31
320 likes | 487 Views
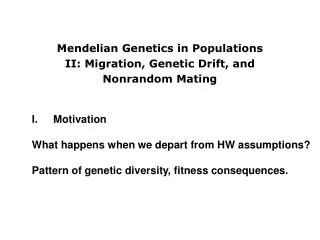
Deviations from HWE I. Mutation II. Migration III. Non-Random Mating IV. Genetic Drift A. Sampling Error. Deviations from HWE I. Mutation II. Migration III. Non-Random Mating IV. Genetic Drift A. Sampling Error

E N D
Deviations from HWE I. Mutation II. Migration III. Non-Random Mating IV. Genetic Drift A. Sampling Error
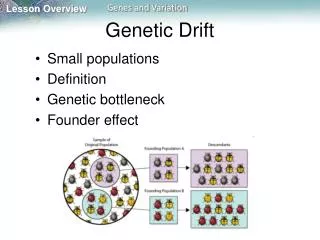
Deviations from HWE I. Mutation II. Migration III. Non-Random Mating IV. Genetic Drift A. Sampling Error 1. samples from a variable population may not represent the population exactly. Deviation from the populational distribution is called sampling error. This is a general statistical principle, measured by the 'variance' or 'standard deviation'. Variance among samples drawn from one population = (pq/N)
Deviations from HWE I. Mutation II. Migration III. Non-Random Mating IV. Genetic Drift A. Sampling Error 1. samples from a variable population may not represent the population exactly. Deviation from the populational distribution is called sampling error. This is a general statistical principle, measured by the 'variance' or 'standard deviation'. Variance among samples drawn from one population = (pq/N) - small samples deviate more, just by chance, from the original population than large samples. - small samples differ more from one another than large samples.
Deviations from HWE I. Mutation II. Migration III. Non-Random Mating IV. Genetic Drift A. Sampling Error 1. samples from a variable population may not represent the population exactly. Deviation from the populational distribution is called sampling error. This is a general statistical principle, measured by the 'variance' or 'standard deviation'. Variance among samples drawn from one population = (pq/N) - small samples deviate more, just by chance, from the original population than large samples. - small samples differ more from one another than large samples.
Deviations from HWE I. Mutation II. Migration III. Non-Random Mating IV. Genetic Drift A. Sampling Error 1. samples from a variable population may not represent the population exactly. Deviation from the populational distribution is called sampling error. This is a general statistical principle, measured by the 'variance' or 'standard deviation'. Variance among samples drawn from one population = (pq/N) - small samples deviate more, just by chance, from the original population than large samples. - small samples differ more from one another than large samples. 2. This principle relates to biological populations because the zygotes produced as an F1 generation represent a sample of the gametes produced by the parental population - not all parents mate.
Deviations from HWE I. Mutation II. Migration III. Non-Random Mating IV. Genetic Drift A. Sampling Error 2. This principle relates to biological populations because the zygotes produced as an F1 generation represent a sample of the gametes produced by the parental population - not all parents mate. - causes of lower effective population size: - only a fraction of parents mate - skewed sex ratio - selection (differential reproduction) - generations overlap (increasing inbreeding/coalescence) - Fluctuation in population size (bottlenecks)
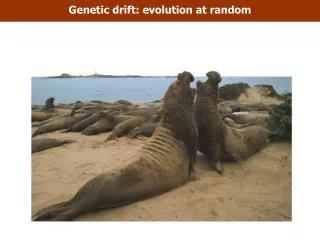
- “Genetic Bottleneck” If a population crashes (perhaps as the result of a plague) there will be both selection and drift. There will be selection for those resistant to the disease (and correlated selection for genes close to the genes conferring resistance), but there will also be drift at other loci simply by reducing the size of the breeding population. Cheetah have very low genetic diversity, suggesting a severe bottleneck in the past. They can even exchange skin grafts without rejection… European Bison, hunted to 12 individuals, now number over 1000. Fell to 100’s in the 1800s, now in the 100,000’s
Deviations from HWE I. Mutation II. Migration III. Non-Random Mating IV. Genetic Drift A. Sampling Error B. Coalescence
B. Coalescence - Not all reproducing entities will leave a descendant. Over time, most lineages will go extinct
B. Coalescence - Not all reproducing entities will leave a descendant. Over time, most lineages will go extinct - After an elapsed time, many of the entities will be descendants of the same successful lineage that, just by chance, has left a descendant in each generation. So, over time, average relatedness among existing entities increases.
B. Coalescence - Not all reproducing entities will leave a descendant. Over time, most lineages will go extinct - After an elapsed time, many of the entities will be descendants of the same successful lineage that, just by chance, has left a descendant in each generation. So, over time, average relatedness among existing entities increases. - Eventually, all the entities that are present will trace their ancestry back to a single ancestor; their genealogies 'coalesce' on a single ancestor
B. Coalescence - Not all reproducing entities will leave a descendant. Over time, most lineages will go extinct - After an elapsed time, many of the entities will be descendants of the same successful lineage that, just by chance, has left a descendant in each generation. So, over time, average relatedness among existing entities increases. - Eventually, all the entities that are present will trace their ancestry back to a single ancestor; their genealogies 'coalesce' on a single ancestor. - If the entity is a single gene or a haploid genome, this means that eventually, all the entities in the populations are the same - 'similar by descent'... If this is an allele, the allele is now FIXED f = 1.0. ***When random change occurs, it will ultimately lead to fixation and inbreeding***
Deviations from HWE I. Mutation II. Migration III. Non-Random Mating IV. Genetic Drift A. Sampling Error B. Coalescence C. Evolution by Drift
C. Evolution by Drift - So, by chance, one allele in the population will become fixed. The probability = frequency in the population (p). Even one NEW allele with frequency 1/2N, has that chance of eventually becoming fixed...
C. Evolution by Drift - So, by chance, one allele in the population will become fixed. The probability = frequency in the population (p). Even one NEW allele with frequency 1/2N, has that chance of eventually becoming fixed... - How long will fixation take? It depends on the population size. Essentially, how long will it take for one gene to replace all the others, just by chance? For a single newly formed allele to take over = 4N generations
C. Evolution by Drift - So, by chance, one allele in the population will become fixed. The probability = frequency in the population (p). Even one NEW allele with frequency 1/2N, has that chance of eventually becoming fixed... - How long will fixation take? It depends on the population size. Essentially, how long will it take for one gene to replace all the others, just by chance? For a single newly formed allele to take over = 4N generations ***The time it takes for an allele to become fixed is dependent on its initial frequency and the size of the population***
IV. Genetic Drift A. Sampling Error B. Coalescence C. Evolution by Drift D. Effects on Variability
D. Effects on Variability 1. Heterozygosity is maximal when all alleles are at = frequency (if two alleles, then p = q = 0.5).
D. Effects on Variability 1. Heterozygosity is maximal when all alleles are at = frequency (if two alleles, then p = q = 0.5). 2. As genes drift from low to intermediate frequency (0.1 0.5), variation (heterozygosity) increases. But, usually, rare alleles drift to 0 and abundant alleles drift to 1, reducing heterozygosity and variation. Ht = Ho [(1 - 1/2N)^t] *** Drift, like inbreeding, leads to reduced heterozygosity over time ***
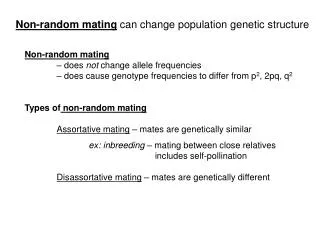
E. Subdivided Populations 1. Wahlund Effect Consider a population that is subdivided on two islands: Island 1: p=0.3, q=0.7 Island 2: p=0.7, q=0.3 Subdivided populations will have lower heterozygosity than expected by HWE when considering them as one fused population.
E. Subdivided Populations 1. Subdivided populations will have lower heterozygosity than expected by HWE when considering them as one fused population. 2. However, in a metapopulation consisting of separate populations in which drift is fixing different alleles, drift increases the variance between populations.
E. Subdivided Populations 1. Subdivided populations will have lower heterozygosity than expected by HWE when considering them as one fused population. 2. However, in a metapopulation consisting of separate populations which drift to fix different alleles, drift increases variance between populations. 3. The rate of decline in heterozygosity at the metapop level depends on the size of the demes (populations). Ht = Ho [(1 - 1/2N)^t], where: Ho = initial heterozygosity, N = mean deme size, t = number of generations, and Ht = Heterozygosity in generation t. ***Subdivision of populations will reduce heterozygosity in the population as a function of the Wahlund Effect AND increase variance due to drift. The rate depends on the mean size of the demes***
IV. Genetic Drift ****F. Relationships Between Inbreeding and Drift****
IV. Genetic Drift ****F. Relationships Between Inbreeding and Drift**** 1. In small populations, offspring have a higher probability of receiving genes from a common source. For instance, if there is one gravid female that founds a population, all individuals in the next generation will be related by and average of 1/2 (full siblings).
IV. Genetic Drift ****F. Relationships Between Inbreeding and Drift**** 1. In small populations, offspring have a higher probability of receiving genes from a common source. For instance, if there is one gravid female that founds a population, all individuals in the next generation will be related by and average of 1/2 (full siblings). 2. Also, over time, coalescence is more rapid in a small population than in a large population; so the population will sooner reach a point where autozygosity is likely. after t generations: Ft = 1 - (1- (1/2N)^t) Ht = (1- (1/2N)^t)Ho)
IV. Genetic Drift ****F. Relationships Between Inbreeding and Drift**** 3. As we saw from the Wahlund Effect, a subdivided population will decline in mean heterozygosity. And we can measure this divergence as a proportional loss of heterozygosity: (2pq - H)/2pq
IV. Genetic Drift ****F. Relationships Between Inbreeding and Drift**** 3. As we saw from the Wahlund Effect, a subdivided population will decline in mean heterozygosity. And we can measure this divergence as a proportional loss of heterozygosity: (2pq - H)/2pq HEY!!! BUT THIS WAS THE FORMULA FOR INBREEDING, TOO! F = (2pq - H)/2pq
IV. Genetic Drift ****F. Relationships Between Inbreeding and Drift**** 1. In small populations, offspring have a higher probability of receiving genes from a common source. For instance, if there is one gravid female that founds a population, all individuals in the next generation will be related by and average of 1/2 (full siblings). 2. Also, over time, coalescence is more rapid in a small population than in a large population; so the population will sooner reach a point where autozygosity is likely. 3. As we saw from the Wahlund Effect, a subdivided population will decline in mean heterozygosity, and increase inbreeding. *** SO! Drift causes a reduction in variability, an increase in inbreeding, and a decrease in heterozygosity. However, it INCREASES the variance BETWEEN populations, reflected in increased divergence and a decline in mean heterozygosity ***
IV. Genetic Drift ****F. Relationships Between Inbreeding and Drift**** SO SO SO!!! DRIFT CAUSES: inbreeding loss of heterozygosity in metapopulation divergence