Download
1 / 35
380 likes | 498 Views
Challenges facing the financing of public and private health care in Namibia. Dr Norbert. P. Forster Deputy Permanent Secretary, MoHSS Namibia Medical Society Health Economics Seminar 18 th April 2015 Hotel Thule Windhoek, Namibia. OUTLINE.

E N D
Challenges facing the financing of public and private health care in Namibia Dr Norbert. P. Forster Deputy Permanent Secretary, MoHSS Namibia Medical Society Health Economics Seminar 18th April 2015 Hotel Thule Windhoek, Namibia
OUTLINE • Conceptual: Health System definition Universal Health Coverage & Health Financing definitions Modes of Financing – their attributes • Namibia: Challenges and issues in our Health System’s Financing and Management • Conclusion
Defining Healthcare “All goods and services designed to promote health, including preventive, promotive, curative, rehabilitative and palliative interventions, whether directed to individuals or to populations.” Source: WHO (2000) World Health Report 2000
Definition of a health system? “ A health system consists of all organisations, people and actions whose primary intent is to promote, restore, or maintain health” WHO, 2007
Governance & Leadership Responsiveness (to people’s expectations) Creating Resources (investment in HR & training; information & knowledge; health technologies) Service Delivery Improved Health Financing (collecting, pooling and purchasing) Social & Financial risk protection The WHO Health System Framework GOALS / OUTCOMES OF THE SYSTEM OUT PUTS FUNCTIONS THE SYSTEM PERFORMS I N P U T S Access & Coverage Efficiency Provider Performance Quality & Safety Source: WHO (2007)
What is Universal Health Coverage? Define as: • All people can use the promotive, preventive, curative, rehabilitative and palliative health services they need. Three Key Attributes: • Equity in access to health services – those who need the services should get them, not only those who can pay for them. • Sufficient quality and quantity of health services – enough to improve the health of those receiving them. • Risk protection – the cost of using care should not put people into financial hardship.
The Key Components of a system of Universal Health Coverage Source of finance and volume (who pays? how? Who regulates? how?) Financial intermediaries (who administers the funds? how? who regulates? how?) Service providers (who spends the funds? how? who ensures cost-benefit and quality? how?) Service recipients (who benefits? how and how much? any co-payments? what benefit-package?)
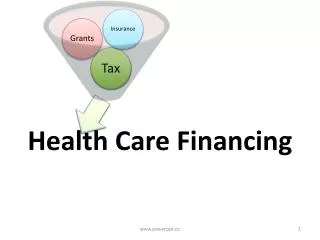
Health financing functions Source: Schieber and Maeda 1997, The World Bank
2005 World Health Survey: Out of pocket payment 71 Countries Incl. Namibia Source: WHO (2007)
Significance of out-of-pocket payment for health • Catastrophic health expenditure refers to household spending on health care of >10% of total household consumption expenditure • South Africa (2009): 23% of households spend more than 10% 15% of households spend more than 15%
Risk pooling mechanisms Risk pooling should collect and manage funds so that unpredictable individual financial risks become predictable and are distributed among all participants of the pool. Four types of health financing are widely used to pool risks, raise revenues, purchase services and pay providers: • National/state health service • Social security • Voluntary private health insurance • Community-based health insurance No pure mechanism, usually a mix of two or more methods
National (state-funded) health care system • Characteristics: funding comes from general revenues, universal coverage, a public health delivery system • Strengths: comprehensive coverage of the population, and large scope for raising resources • Weaknesses: unstable funding; disproportionate benefits for the rich; potential inefficiency in health care delivery; and sensitivity to political pressures
Social health insurance (social security • Characteristics: funding from employee and employer contributions; management through sickness funds; benefit package for all members (fully or partially cover) • Strengths: more resources in the system; less dependence on budget negotiations; high redistributive dimension (cross subsidies) • Weaknesses: exclusion of the poor/unemployed; negative economic impact on payroll contributions; complex and expensive to manage; escalating costs; coverage of chronic diseases and preventive care
Voluntary (private) health insurance • Characteristics: affiliation is voluntary; may be primary or additional source of healthcare funding; may be the main source of health coverage, or cover services not included by the public service • Strengths: affords financial protection; enhances access; increases service capacity and promotes innovation; helps finance health care services not covered publicly (OECD, 2004) • Weaknesses: financial barriers to access; differential access to health care; high administrative costs; removes little cost pressure from public health financing
Community-based health insurance • Characteristics: community membership; high community involvement in managing the system; beneficiaries are excluded from other kinds of health coverage; members strongly share a set of social values (voluntary affiliation, participation and solidarity) • Strengths: better access to healthcare for low-income people; may fill the gaps of other health financing schemes • Weaknesses: limited protection for members; sustainability is questionable; limited benefits to the poorer part of the population
Important aspects of the healthcare market to be controlled • Consumer moral hazard • A zero (or reduced) price at the point of use encourages a higher rate of use than would otherwise be considered efficient • Adverse selection • The process whereby the ‘best risk’ individuals are selected out of a general insurance pool • Provider moral hazard (SID) • Incentives on suppliers (e.g. physicians) to provide care in excess of (or short of) that which would be arrived at by trading with fully informed consumers
Financing mechanisms in high-income countries (Source: OECD 2004)
NAMIBIA’S FOURTH NATIONAL DEVELOPMENT PLAN2012/13 TO 2016/17 “ Changing Gear Towards Vision 2030” Source: National Planning Commission (OP)(August 2012) Priority 1 is to put in place basic economic development enablers: • Enabling Institutional Environment • Improve Education and Skills • Establish a Quality Health System
NAMIBIA’S FOURTH NATIONAL DEVELOPMENT PLAN2012/13 TO 2016/17 Where we want to be in 2030: “A prosperous and industrialised Namibia, developed by her human resources, enjoying peace, harmony and political stability.” (Source: OP, 2004) NDP4 Desired Outcome 1 (DO1): “By the year 2017, Namibia is the most competitive economy in the SADC region, according to the standards set by the World Economic Forum.” (Source: NDP4, 2012, p33)
WORLD ECONOMIC FORUM (WEF): 2013-2014 GLOBAL COMPETITIVENESS REPORT: NAMIBIA RANKING ( /148) 4th Pillar: Health and primary education (25% of Basic Enablers): A. Health: 123 4.01 Business impact of malaria 118 4.02 Malaria incidence 101 4.03 Business impact of tuberculosis 141 4.04 Tuberculosis incidence 145 4.05 Business impact of HIV/AIDS 145 4.06 HIV prevalence 142 4.07 Infant mortality 105 4.08 Life expectancy 119 B. Primary education: 4.09 Quality of primary education 4.10 Primary education enrollment rate (WEF, Geneva, Switzerland, September 2013)
WORLD ECONOMIC FORUM (WEF): 2013-2014 GLOBAL COMPETITIVENESS REPORT: NAMIBIA RANKING (92/148) “ Namibia must improve its health and educational systems. The country is ranked a low 123rd on the health sub pillar (down five places), with high infant mortality and low life expectancy – the result in large part, of high rates of communicable diseases.” (WEF, Geneva, Switzerland, September 2013, pp 43-44)
THE NAMIBIAN HEALTH SYSTEM • Accessed mostly by the middle to high income population • Driven by participation in medical aid schemes • Provides care through a network of private providers Private healthcare system (15% of Namibian population) Informal sector • Recognised as an alternative source of care; no exact data on utilisation • traditional health practitioners Communities NGO / donor community Public healthcare system (85% of Namibian population) • Large NGO focus on HIV / AIDS (over 300 HIV/AIDS NGOs); relatively small engagement in broader health; • Presence of few large donors including: :PEPFAR*, GFATM**, Bilaterals • Increasing South-South cooperation Individual • Accessed by the lower income population • Driven by a primary health care approach to ensure health at the local level • Provides care through a series of outreach, clinics, health centres and hospitals Church health services • Driven by the Anglican, Lutheran and Roman Catholic Health Services • 100% of operational funding from MOHSS • Providers of outpatient and inpatient care • Mostly Northern regions • Updated Agreement 2008 Provides funding Provides funding * PEPFAR - President’s Emergency Plan for AIDS relief ** GFATM - Global Fund for AIDS, TB and Malaria Source: Team analysis; Interviews
HIGH GINI COEFFICIENT, VAST INEQUITIES, VARIOUS CONCURRENT EPIDEMICS 58 Inequality in income 2007-2008, Gini coefficient Northern regions: highest population density, lowest income per capita ;most cases of communicable, diseases (e.g., HIV/AIDS, TB, Malaria) Namibia 74 South Africa 58 Brazil 57 Central regions: highest income per capita; high burden of poverty related and increasing NC diseases (e.g. HIV/AIDS, TB, malnutrition, diarrhoea, HT, DM etc.) Kenya 43 United States 41 France 33 The Southern regions: sparsely populated; subsistence farming; mixed disease burden : TB, NCDs, alcohol and tobacco, trauma Sweden 25 Source: UNDP: Human Development Report 2007/8; Team analysis
CHALLENGE: HOW TO REACH THE 2015 MDG TARGETS … 69 Infant Mortality # per 1 000 live births Maternal Mortality # per 100, 000 live births 20* No data 1990 1995 2000 2006 2013 2015 1990 1992 2000 2006 2013 2015 Under-5 Mortality # per 1 000 live births Life Expectancy at Birth Age (years) 1990 1995 2000 2006 2013 2015 1990 1995 2000 2005 2010 * Calculated ** Roadmap for Accelerating the Reduction of Maternal and Newborn Morbidity and Mortality Report; MOHSS Source: WHO Core Health Indicators; World Bank Development Indicators; DHS, 2000, 2006; MOHSS Interviews
REDUCTION IN LIFE EXPECTANCY ATTRIBUTABLE TO COMMUNICABLE DISEASES 10 Years lost to various conditions 2007, Years Estimated DALYs* by cause (‘000) 2004, Percent 10.0 Injuries 100% = 647 0.6 Other Communicable Non- Communicable Diseases 1.1 Nutritional Deficiencies TB Diarrhea Malaria Communicable Diseases Perinatal Conditions** 8.3 67 HIV/AIDS 2007 * DALY - Disability Adjusted Life Year ** Low birth-weight, asphyxia, and birth trauma Source: WHO Statistical Database; WHO DALY by Region database 2004
ACCESS TO CARE: OVER 40% LIVE FURTHER THAN 5 KM FROM A HEALTH FACILITY (2007) 41 >3 hours 2-3 hours 1-2 hours <1 hour Population living greater than 5 km from a health facility Percent Distribution of waiting times in health facilities Percent (N=659) Ohangwena Kunene 12 12 Omaheke Oshikoto Khomas 9 10 Kunene Oshikoto 26 13 Omusati Hardap Oshana 40 22 Otjozondjupa 40% of the population lives further than 5 km from health facility Caprivi Kavango 27 10 Kavango Karas Hardap 9 0 Oshana Erongo Namibia 24 13 Khomas 26
Developments in Health Inequities – Namibia 2006/07 to 2013 Source: MoHSS, DHS 2006/07, NDHS 2013
~30% VACANCIES OF MoHSS FRONTLINE STAFF IS A PRESSING ISSUE – MTAMBANENGWE COMMISSION 22 Vacant Filled NOT EXHAUSTIVE Namibian health workers 2007 Filled posts vs. vacancies of selected roles in MOHSS Percent Gap, # of staff 100% = 100% = 6 300 79 Social workers 49% 51% 155 workers Private 38 % 10 Dentists 52% 48% 21 19 Pharmacists 59% 41% 46 116 Doctors** 65% 35% 332 Public and mission 62 % 638 Enrolled nurses 74% 26% 2 482 457 Registered nurses 78% 22% 2 083 Number of health workers* * Including doctors, registered nurses, enrolled nurses, dentists, dental therapists, dental technicians, pharmacists, pharmacist assistants, physiotherapists, occupational therapists, environmental health workers ** Including medical officers and medical specialists Source: MOHSS Annual Report 2006-07– HRD Policy and Planning; Team analysis 28
Africa (selected countries): Density of health workforce (per 10,000 population) for 2011 Source: WHO (2014) The African Regional Health Report
NEED FOR MoHSS PRODUCTIVITY AND EFFICIENCY IMPROVEMENTS 10 Productivity of Namibian referral hospitals 2003-2005 Theoretical performance gap Oshakati Hospital* Occupancy rate Percent Length of stay Days Length of stay Days Oshakati -17% Rundu Current New Katutura Equivalent to 113 beds Windhoek Central Occupancy rate Percent -17% District Hospitals Average utilisation of referral hospitals (75%) Average utilisation of referral hospitals (10 days) Current New * Assumptions include constant bed demand; nil additional capacity (e.g., human resources, equipment etc.) Source: MOHSS Health Essential Indicators; Team analysis
NAMIBIA HEALTHCARE FUNDING 2005/06 1,68 Health care spending as a percentage of GDP 2005/06, Percent • Namibia falling short of all benchmark countries • Botswana and SA are the countries investing relatively more in health care Nam** Swaz Bots SA Cuba • Several countries are falling short of the 15% Abuja target • Recent increases in expenditure have brought Namibia closer to the Abuja target Health care expenditure as a percentage of total government expenditure 2005/06, Percent 15% Abuja target Nam Bots SA Ugan Cuba PPP adjusted health care spending per capita 2005/06, International USD • Botswana and SA are investing significantly more than other countries • Namibia is more in line with Swaziland and Cuba Nam Swaz Bots SA Ugan Cuba * Budgeted amount **Includes subsidies for consistency across benchmark countries; Source: WHO; National Health Accounts; MoF MTEF 2008-2011; Vote 13 - speech by the Minister of Health; Team analysis
Africa (Selected countries) Health Expenditure Indicators for 2011 Source: WHO (2014) The African Regional Health Report 2014
MORE FOCUS ON CLINICAL LEADERSHIP FOR BETTER OVERALL PERFORMANCE 2 • Key barriers • No clear financial incentives, e.g., marginally better salaries • No well-defined career path or development track • Infrastructure of leadership is poor, e.g., lack of networking, supervision or mentorship • Performance appraisals (if they happen) are often ‘box-ticking’ exercises Clinical leadership is critical to improving health system performance… …however underlying barriers to improving clinical leadership exist: • London School of Economics (LSE) • Hospitals with greatest clinician involvement in management scored 50% higher on key measures of organisational performance • NHS England • In 11 cases of attempted service improvement, organisations with stronger clinical leadership were more successful in delivering change • Very seldom that high performing health organisations have low or limited clinical leadership 1 Formal systems hamper the developmnt of clinical leadership • Key barriers • Lack of data to demonstrate the impact and value of clinical leadership • Opportunity costs of leadership seen as too high, e.g., shortage of staff • Clinical leadership not vital to an individual’s professional success • Clinical leadership not core to clinicians’ professional identity, e.g., “I’m a doctor, not a manager” Barriers to clinical leadership 2 3 Leadership Capability of Clinicians not systematically nurtured Common beliefs paint clinical leadership as low value • Key barriers • Leadership training not core part of curricula • Limited training provided to foreign nationals who account for 2/3 of the doctors • Leadership development not connected to the day-job • Little follow-up or evaluation of impact of training 33 Source: McKinsey (2007) Interviews; Team analysis
CONCLUSION • Health systems are open systems subject to very complex dynamics. • Decisions on Healthcare financing are wide-ranging and must be thought through well. • Namibia’s health system needs focused attention to improve both equity and efficiency. • Increased investment in priority programmes is highly important also to compensate for donor withdrawal. • Very high quality leadership is key.
TANGI UNENE OKUHEPA THANK YOU “We are required to walk our own road – and then stop, assess what we have learned and share it with others. It is only in this way that the next generation can learn from those who have walked before them.” ~ AlbertinaSisulu (R/n)