Download
1 / 24
240 likes | 326 Views
Sub-Doppler Spectroscopy of H 3 +. James N. Hodges , Adam J. Perry, Brian M. Siller , Benjamin J. McCall. Outline. Motivation Fundamental Physics Astronomy Instrument Description Transition Frequency Results Wavelength Calibration Testing. H 3 + Fundamental Benchmark.

E N D
Sub-Doppler Spectroscopy of H3+ James N. Hodges, Adam J. Perry, Brian M. Siller, Benjamin J. McCall
Outline • Motivation • Fundamental Physics • Astronomy • Instrument Description • Transition Frequency Results • Wavelength Calibration Testing
H3+ Fundamental Benchmark • Simplest polyatomic ion • Benchmark for ab initio theory • Accuracy of order 300 MHz @ low energy • QED corrections are frontier • Accuracy of order 30 MHz @ low energy • Requires higher precision data O. L. Polyansky, J. Tennyson, J. Chem. Phys. (1999), 110, 5056-5064. J. Komasa, et al. J. Chem. Theor. Comp. (2011), 7, 3105-3115.
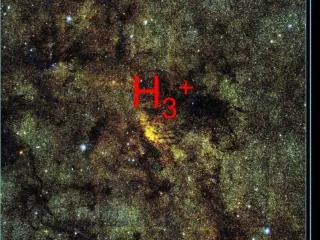
H3+ Astronomically Important • Abundant in Interstellar Medium • Deuterium Fractionation • Found in Ionospheres of Gas Giants • Measure Speed of Auroral Winds • Limited by Laboratory Accuracy T. R. Geballe and T. Oka, Nature (1996), 384, 334. P. Drossart et al. Nature (1989), 340, 539. D. Rego et al. Nature (1999), 399, 121. Images From: http://solarsystem.nasa.gov/planets/profile.cfm?Object=Jupiter http://www.ucl.ac.uk/~ucaptss/work/publications/royalsoc/energy.htm
Spectroscopic Technique Large Signal Cavity Enhancement NICE-OHVMS Low Noise Heterodyne Spectroscopy Ion Selectivity Velocity Modulation Noise Immune Cavity Enhanced Optical Heterodyne Velocity Modulation Spectroscopy B. M. Siller, et al. Opt. Express (2011), 19, 24822-7.
Instrumental Layout ni = np - ns I P S OPO Freq. Comb AOM 90o Phase Shift Wave-meter 40 kHz Plasma Frequency 2f Lock-In Amplifier EOM Lock-In Amplifier 80 MHz 1 × Cavity Free Spectral Range YDFL X & Y Signal X & Y Signal K. N. Crabtree, et al. Chem. Phys. Lett. (2012), 551, 1-6.
Comb Calibration Freq. Comb AOM Wave-meter […] Signal Pump
Comb Calibration Freq. Comb AOM Wave-meter […] Signal Pump
Comb Calibration Freq. Comb AOM Wave-meter […] Signal Signal Pump
H3+ Spectra Doubly Degenerate 2 Band Signal Signal H3+ Transition Notation
Lamb Dips & Saturation • High Power Optical Saturation Lamb dips • Second Comb Calibrated Observation of Lamb dips • In NICE-OHVMS fm-triplet causes many Lamb dips H.-C. Chen et al. Phys. Rev. Lett. (2012), 109, 263002. K.N. Crabtree et al. Chem. Phys. Lett. (2012), 551, 1.
Lamb Dips & Saturation • High Power Optical Saturation Lamb dips • Second Comb Calibrated Observation of Lamb dips • In NICE-OHVMS fm-triplet causes many Lamb dips H.-C. Chen et al. Phys. Rev. Lett. (2012), 109, 263002. K.N. Crabtree et al. Chem. Phys. Lett. (2012), 551, 1.
Lamb Dips & Saturation • High Power Optical Saturation Lamb dips • Second Comb Calibrated Observation of Lamb dips • In NICE-OHVMS fm-triplet causes many Lamb dips H.-C. Chen et al. Phys. Rev. Lett. (2012), 109, 263002. K.N. Crabtree et al. Chem. Phys. Lett. (2012), 551, 1.
Lamb Dips & Saturation • High Power Optical Saturation Lamb dips • Second Comb Calibrated Observation of Lamb dips • In NICE-OHVMS fm-triplet causes many Lamb dips H.-C. Chen et al. Phys. Rev. Lett. (2012), 109, 263002. K.N. Crabtree et al. Chem. Phys. Lett. (2012), 551, 1.
Lamb Dips and Fits R(2,2)l Transition
Transition Frequencies St. Err. = St. Dev. Of Mean
Lamb Dip Signal-to-Noise-Ratio Lamb Dip SNR:
Lamb Dip Signal-to-Noise-Ratio R(3,2)l R(1,0)
Frequency Calibration Test • First use of a comb with this instrument • Need to ensure proper calibration • Lamb dips of methane
Instrumental Layout ni = np - ns I P S OPO Freq. Comb AOM 90o Phase Shift Wave-meter 1.4 kHz Modulation Frequency 40 kHz Plasma Frequency 2f 3f Lock-In Amplifier EOM Lock-In Amplifier 80 MHz 1 × Cavity Free Spectral Range YDFL X & Y Signal X & Y Signal
Frequency Calibration Test • First use of a comb with this instrument • Need to ensure proper calibration • Lamb dips of methane • Acquired Lamb dips for F1(2) component of P(7) transition of 3 band
Frequency Calibration Test Lamb dip of methane Fit with 2ndderivative of Lorentzian 5 kHz diff. from Takahataet al. ~30 kHz st.dev. from fit K. Takahata et al. Phys. Rev. A. (2009) 80, 032518.
Conclusions Comb calibrated H3+ transitions reported Higher S/N lines have sub-MHz precision Methane used to validate comb calibration Values differ than Chen et al. H.-C. Chen et al. Phys. Rev. Lett. (2012), 109, 263002.
Acknowledgements Springborn Fellowship NSF GRF (DGE 11-44245 FLLW)