Download
1 / 1
10 likes | 97 Views
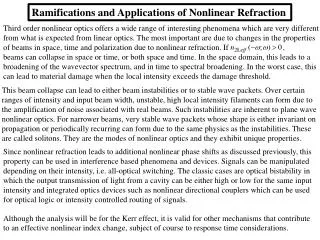
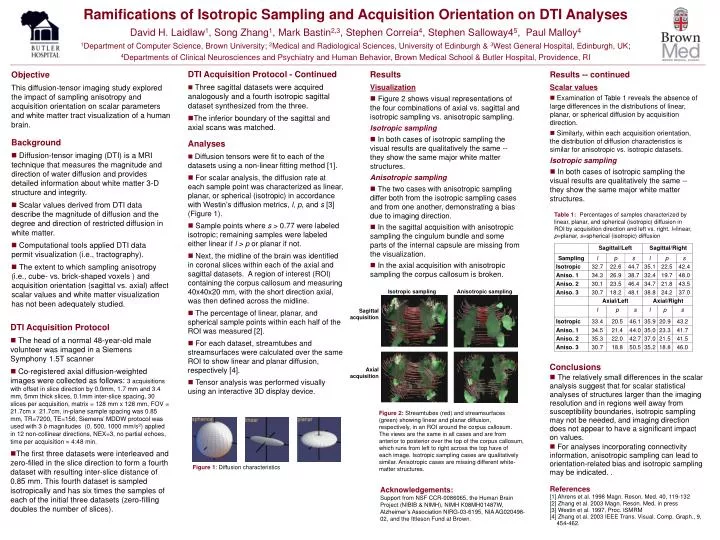
Isotropic sampling. Anisotropic sampling. Sagittal acquisition. Axial acquisition. Ramifications of Isotropic Sampling and Acquisition Orientation on DTI Analyses David H. Laidlaw 1 , Song Zhang 1 , Mark Bastin 2,3 , Stephen Correia 4 , Stephen Salloway4 5 , Paul Malloy 4

E N D
Isotropic sampling Anisotropic sampling Sagittal acquisition Axial acquisition Ramifications of Isotropic Sampling and Acquisition Orientation on DTI Analyses David H. Laidlaw1, Song Zhang1, Mark Bastin2,3, Stephen Correia4, Stephen Salloway45, Paul Malloy4 1Department of Computer Science, Brown University; 2Medical and Radiological Sciences, University of Edinburgh & 3West General Hospital, Edinburgh, UK; 4Departments of Clinical Neurosciences and Psychiatry and Human Behavior, Brown Medical School & Butler Hospital, Providence, RI • DTI Acquisition Protocol - Continued • Three sagittal datasets were acquired analogously and a fourth isotropic sagittal dataset synthesized from the three. • The inferior boundary of the sagittal and axial scans was matched. Results Visualization • Figure 2 shows visual representations of the four combinations of axial vs. sagittal and isotropic sampling vs. anisotropic sampling. Isotropic sampling • In both cases of isotropic sampling the visual results are qualitatively the same -- they show the same major white matter structures. Anisotropic sampling • The two cases with anisotropic sampling differ both from the isotropic sampling cases and from one another, demonstrating a bias due to imaging direction. • In the sagittal acquisition with anisotropic sampling the cingulum bundle and some parts of the internal capsule are missing from the visualization. • In the axial acquisition with anisotropic sampling the corpus callosum is broken. Objective This diffusion-tensor imaging study explored the impact of sampling anisotropy and acquisition orientation on scalar parameters and white matter tract visualization of a human brain. Results -- continued Scalar values • Examination of Table 1 reveals the absence of large differences in the distributions of linear, planar, or spherical diffusion by acquisition direction. • Similarly, within each acquisition orientation, the distribution of diffusion characteristics is similar for anisotropic vs. isotropic datasets. Isotropic sampling • In both cases of isotropic sampling the visual results are qualitatively the same -- they show the same major white matter structures. Background • Diffusion-tensor imaging (DTI) is a MRI technique that measures the magnitude and direction of water diffusion and provides detailed information about white matter 3-D structure and integrity. • Scalar values derived from DTI data describe the magnitude of diffusion and the degree and direction of restricted diffusion in white matter. • Computational tools applied DTI data permit visualization (i.e., tractography). • The extent to which sampling anisotropy (i.e., cube- vs. brick-shaped voxels ) and acquisition orientation (sagittal vs. axial) affect scalar values and white matter visualization has not been adequately studied. • Analyses • Diffusion tensors were fit to each of the datasets using a non-linear fitting method [1]. • For scalar analysis, the diffusion rate at each sample point was characterized as linear, planar, or spherical (isotropic) in accordance with Westin’s diffusion metrics, l, p, and s [3] (Figure 1). • Sample points where s > 0.77 were labeled isotropic; remaining samples were labeled either linear if l > p or planar if not. • Next, the midline of the brain was identified in coronal slices within each of the axial and sagittal datasets. A region of interest (ROI) containing the corpus callosum and measuring 40x40x20 mm, with the short direction axial, was then defined across the midline. • The percentage of linear, planar, and spherical sample points within each half of the ROI was measured [2]. • For each dataset, streamtubes and streamsurfaces were calculated over the same ROI to show linear and planar diffusion, respectively [4]. • Tensor analysis was performed visually using an interactive 3D display device. Table 1:Percentages of samples characterized by linear, planar, and spherical (isotropic) diffusion in ROI by acquisition direction and left vs. right. l=linear, p=planar, s=spherical (isotropic) diffusion • DTI Acquisition Protocol • The head of a normal 48-year-old male volunteer was imaged in a Siemens Symphony 1.5T scanner • Co-registered axial diffusion-weighted images were collected as follows: 3 acquisitions with offset in slice direction by 0.0mm, 1.7 mm and 3.4 mm, 5mm thick slices, 0.1mm inter-slice spacing, 30 slices per acquisition, matrix = 128 mm x 128 mm, FOV = 21.7cm x 21.7cm, in-plane sample spacing was 0.85 mm, TR=7200, TE=156, Siemens’ MDDW protocol was used with 3 b magnitudes (0, 500, 1000 mm/s2) applied in 12 non-collinear directions, NEX=3, no partial echoes, time per acquisition = 4:48 min. • The first three datasets were interleaved and zero-filled in the slice direction to form a fourth dataset with resulting inter-slice distance of 0.85 mm. This fourth dataset is sampled isotropically and has six times the samples of each of the initial three datasets (zero-filling doubles the number of slices). • Conclusions • The relatively small differences in the scalar analysis suggest that for scalar statistical analyses of structures larger than the imaging resolution and in regions well away from susceptibility boundaries, isotropic sampling may not be needed, and imaging direction does not appear to have a significant impact on values. • For analyses incorporating connectivity information, anisotropic sampling can lead to orientation-related bias and isotropic sampling may be indicated. . Figure 2: Streamtubes (red) and streamsurfaces (green) showing linear and planar diffusion, respectively, in an ROI around the corpus callosum. The views are the same in all cases and are from anterior to posterior over the top of the corpus callosum, which runs from left to right across the top have of each image. Isotropic sampling cases are qualitatively similar. Anisotropic cases are missing different white-matter structures. Figure 1: Diffusion characteristics References [1] Ahrens et al. 1998 Magn. Reson. Med. 40, 119-132 [2] Zhang et al. 2003 Magn. Reson. Med, in press [3] Westin et al. 1997, Proc. ISMRM [4] Zhang et al. 2003 IEEE Trans. Visual. Comp. Graph., 9, 454-462. Acknowledgements: Support from NSF CCR-0086065, the Human Brain Project (NIBIB & NIMH), NIMH K08MH01487W, Alzheimer’s Association NIRG-03-6195, NIA AG020498-02, and the Ittleson Fund at Brown.