Download
1 / 30
300 likes | 305 Views
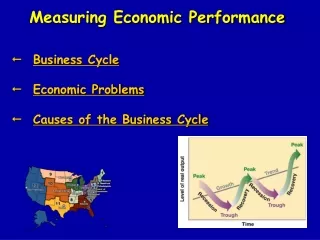
Measuring Economic Development. World Patterns in economic development. Economic activities not evenly spread across the world. Every country experiences different physical and social conditions. World can be divided into 3 regions based on levels of economic development: 1 - Developed

E N D
World Patterns in economic development. • Economic activities not evenly spread across the world. • Every country experiences different physical and social conditions. • World can be divided into 3 regions based on levels of economic development: • 1 - Developed • 2 - Least Developed • 3 - Quickly Developing
1 - Regions with developed countries • Europe, North America, Japan, Australia. • High levels of industrial activity. • Well developed health-care systems • Educated population. • Social and economic equality between sexes. • Low child mortality. • Most employment in services and manufacturing. • Gross National Product (GNP) is high and increasing.
2 - Regions with least developed countries (LDCs) • Many African countries (e.g. Zambia, Ethiopia, Sierra Leone). • Some Asian countries (e.g. Bangladesh, Afghanistan). • Poorest in the world. • Low GNP (less than $750) and may be decreasing. • Low life expectancy • Millions living in absolute poverty. • Disease is common • Government may be corrupt. • Females are often uneducated.(working on land). • Limited manufacturing and services.
Heavily indebted poor countries (HIPCs) • Many LDCs are HIPCs. • Highest levels of poverty in the world. • Eligible for international debt relief measures which aim to reduce their external debt to more manageable levels. • The HIPC programme identifies 38 countries as being potentially eligible to receive debt relief, most of which are in sub-Saharan Africa.
3 – Quickly Developing Countries. • Southeast Asia (e.g. Malaysia, Indonesia, China and India) • Most of South and Central America (e.g. Brazil and Mexico). • North African countries such as Egypt. • Industrialised rapidly in last 15 years. • More jobs became available in manufacturing and services. • However, at risk of exploitation by multinational companies (MNCs) looking for cheap labour. • Healthcare and literacy improving. • GNP is increasing.
Distinct North-South divide in wealth. • 20% of world’s population has 80% of the world’s wealth. • The North also controls 80% of world’s trade and investment, 90% of its industry and almost 100% of its research. • Australia and New Zealand are included in the North even though they are located in the Southern hemisphere.
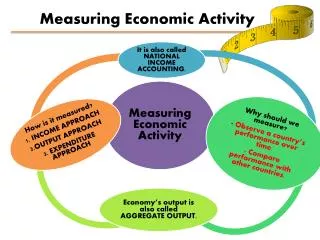
Measuring Economic Development. • Difficult to give a definite measure for the economic development of a country. • Many things can be measured – life expectancy, number of doctors, internet access, car ownership, employment etc. • However there are 2 scales which are most often used to measure economic development of a country: • Gross National Product (GNP) • Its position on the Human Development Index (HDI).
Gross National Product. • The most commonly used measure of a country’s wealth. • It is the value of goods and services produced in a country and by companies from that country which are located abroad. • Sometimes Gross National Income (GNI) is used instead of GNP but we take them to mean the same thing. • Gross Domestic Product (GDP) is the value of goods and services produced by a country’s businesses and organisations plus the value of goods and services produced by foreign-owned business corporations in that country.
Problems using GNP as an indicator of development. • 1 – misleading as its an average figure. • 2 – affected by the proportion of multinational companies in the country who take their profits elsewhere. • 3 – some countries have low GNP but score well in other measures of development, reflecting an investment in social services. • 4 – GNP figures do not reflect living costs in different countries. US$1 in Bangladesh buys much more than it would in the U.S.A.
Human Development Index. • A scoring system to rank countries based on their social and economic conditions. • Always expressed as a number between 0 and 1. • Countries given points based on their progress in three areas of human development: • 1 – A long and healthy life. • 2 – Education. • 3 – A decent standard of living. • As the HDI includes social and economic indicators of development, it provides a broader view of development than GNP. • The HDI is based on people’s needs.
Problems using HDI as an indicator. • 1. Can conceal inequalities within countries. A high score may not apply to entire population. • 2. Not always a direct link with a high score on HDI and high GNP – Middle East countries , Czech Republic. • 3. Not suitable for tracking short term changes in development. 2 factors – adult literacy and life expectancy are not very responsive to short-term policy changes made by governments. • 4. The HDI is not a comprehensive measure.
Some factors which influence the HDI. • Health factors affecting life expectancy are: • Politics – how much government spend on primary health care. • Water availability and access to pure water – 30% of the worlds’ population are at risk from typhoid, cholera etc • Malnutrition • HIV/AIDS – in the southern countries of Africa, 10% of the population are ‘living’ with this disease.
Effects of Aids on Life Expectancy • South Africa: • 1985 – 62 • 2007 - 45
National Debt affects health and literacy programmes: • In 2003 African nations were repaying over 50 billion dollars of debts. • The International Monetary Fund (I.M.F.) provides loans to improve economic performances but under strict conditions (called structural adjustments programmes (SAPs)). • This leads governments to cutback on health, education etc and affects the HDI and can lead to great hardship e.g. Riots in Argentina in 2005.
Economic growth causes: • Average income per person to rise. • Improved HDI as people can afford better medicine, food etc. • Example: • Ireland 1998 – 58% of E.U. Average. • Ireland 2005 – 104% of E.U. Average.
Zimbabwe – An example of Economic Decline in an LDC. • Zimbabwe’s economy is in ruins and it shows that without proper management, a country’s economy can decline and bring massive problems.
Countdown to Economic Ruin • Population – 12 million • Average life expectancy: 1990 – 62, 2004 – 37. • Under- five mortality: 1990 – 80 per 1000, 2005 – 132 per 1000. • Aids – 2001 – 160,000 deaths, 2005 – 180,000. • GDP – 2000 US$7.4 billion, 2005 US$3.4 billion • Inflation – 2000 – 56%, 2006 - 1050%. • Unemployment – 2000 – 20%, 2006 – 75%. • People living below the poverty line – 80%. • Results of this decline – diseases, starvation, unemployment, emigration.
Levels of Economic Development. • Levels of economic development can vary greatly from country to country, region to region, i.e. Economic development is unevenly distributed. • There is an uneven rate of economic development in the world and this has led to a development gap: • Intercontinental regions: ‘north’ and ‘south’. • International e.g. Countries in the same region e.g. South Korea and North Korea. • Within countries e.g. N. Italy and S. Italy.
Economic development should result in : • Prosperity and a decline in poverty • More and better paid employment • A reduction in differences in the quality of life between different regions.
Child Wellbeing Table (2007) • A UN study shows that strong economic growth does not always result in a better quality of life for children. • Using criteria of : education, health care, family relationships, poverty / deprivation • The UN surveyed 21 developed countries: - 1st – Holland, 2nd Sweden, 3rd Denmark, 12th Ireland, 21st Britain. • In countries that are poorer than Ireland and Britain children were better off – e.g. Czech Republic