Download
1 / 2
20 likes | 98 Views
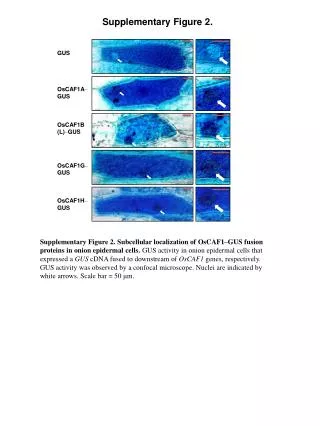
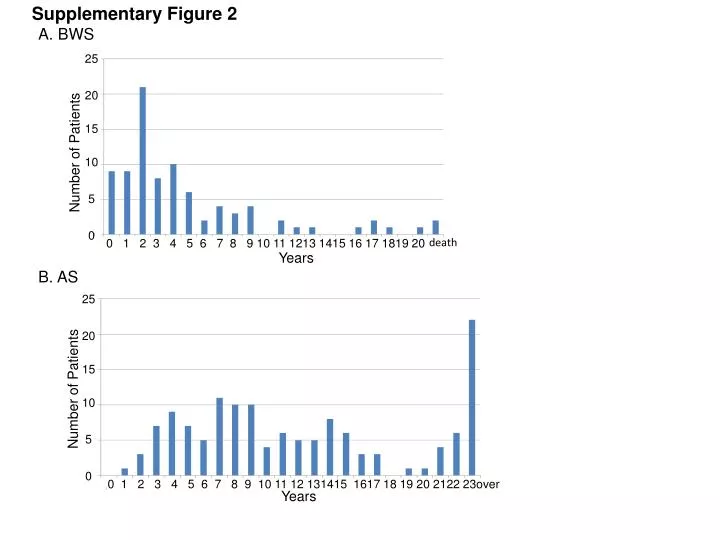
Supplementary Figure 2. A. BWS. Number of Patients. 0 1 2 3 4 5 6 7 8 9 10 11 1213 1415 16 17 1819 20. death. 0 1 2 3 4 5 6 7 8 9 10 11 12 131415 1617 18 19 20 2122 23over. Years. B. AS. 25 20 15 10 5 0.

E N D
Supplementary Figure 2 A. BWS Number of Patients 0 1 2 3 4 5 6 7 8 9 10 11 1213 1415 16 17 1819 20 death 0 1 2 3 4 5 6 7 8 9 10 11 12 131415 1617 18 19 20 2122 23over Years B. AS 25 2015 10 5 0 25 2015 10 5 0 Number of Patients Years
C. PWS Number of Patients 0 1 2 3 4 5 6 7 8 9 10 11 12 13 14 15 16 17 18 19 20 0 1 2 3 4 5 6 7 8 9 10 11 12 131415 1617 18 19 20 2122 23over Years D. SRS 50 4030 20 10 0 10 86 4 2 0 Number of Patients Years