Download
1 / 25
250 likes | 330 Views
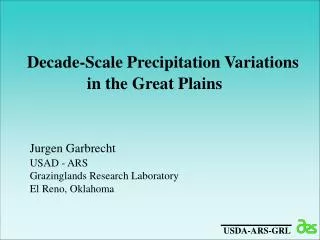
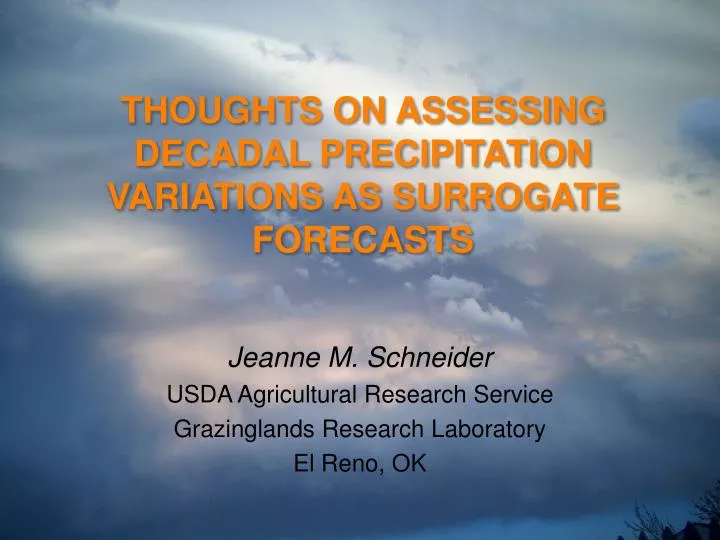
THOUGHTS ON ASSESSING DECADAL PRECIPITATION VARIATIONS AS SURROGATE FORECASTS. Jeanne M. Schneider USDA Agricultural Research Service Grazinglands Research Laboratory El Reno, OK.

E N D
THOUGHTS ON ASSESSING DECADAL PRECIPITATION VARIATIONS AS SURROGATE FORECASTS Jeanne M. Schneider USDA Agricultural Research Service Grazinglands Research Laboratory El Reno, OK
But first, a quick review/tutorial on probability of exceedance functions….which illustrates why someone might want to use them.
"a posteriori" Probability of Exceedance = 1 - (cumulative probability density function)
Probability of Exceedance (%) “Two in three chance for more than 3.2 inches.” 67% 3.2” Precipitation (inches)
Probability of Exceedance (%) “Two in three chance for more than 3.2 inches.” 67% “Fifty-fifty chance for more than 4.2 inches.” 50% 3.2” 4.2” Precipitation (inches)
Probability of Exceedance (%) “Two in three chance for more than 3.2 inches.” 67% “Fifty-fifty chance for more than 4.2 inches.” 50% “One in three chance for more than 6.1 inches.” 33% 3.2” 4.2” 6.1” Precipitation (inches)
If you can associate a potential financial loss with each of these outcomes, then you have a definition of “risk”. Probability of Exceedance (%) “Two in three chance for more than 3.2 inches.” 67% “Fifty-fifty chance for more than 4.2 inches.” 50% “One in three chance for more than 6.1 inches.” 33% 3.2” 4.2” 6.1” Precipitation (inches)
Continuing where we left off last year…. So, what do we plan to do when the NOAA/CPC forecasts offer nothing beyond the 30-year climatology ("EC")? Or when the forecast skill is so low as to preclude practical use? Do we have any other options for climate-conditioned decision support for agriculture in areas where ENSO impacts are marginal?
Annual Precipitation in Central Oklahoma 5 5 Dry Periods Annual Precipitation Wet Periods 4 5 Precipitation [in] 3 5 2 5 5-yr weighted average CD3405; 1895-2004 1 5 1 8 9 5 1 9 1 5 1 9 3 5 1 9 5 5 1 9 7 5 1 9 9 5 Year
Probability of Exceedance of September Precipitation Climate Division 3405; Central Oklahoma; 1895-2005 1 Wet periods 1905-1908 1941-1945 1957-1961 1982-2000 Wet Periods Mean = 4.6 [in] 33 Years 0.8 Dry periods 1900-1904 1909-1917 1936-1939 1952-1956 1963-1972 1976-1980 0.6 Prob. of Exceedance 0.4 1895-2005 Mean = 3.7 [in] 111 Years Dry Periods Mean = 3.2 [in] 38 Years 0.2 Preliminary data, subject to revision 0 0 1 2 3 4 5 6 7 8 9 10 11 Precipitation [in/mo] USDA-ARS-GRL
A faint flavor of chaotic dynamics: Assume that the earth/ocean/atmosphere system behaves as a chaotic system with a very large number of degrees of freedom, but that the net expression of that chaos on the precipitation processes at any location can be usefully described as a small collection of states (dry, wet, perhaps transition), where each state persists for several years.
But there are problems with statistical approaches to climate forecasts: Climate changes: To what degree does the past predict the future? Data is incomplete and imperfect: if a predictive signal exists in the phenomena, can we discern it in the record? Where, when, and how do we search for the signal? And on and on, ad nauseum….
However, as has been noted by several presenters already:"….decisions have to be made".
The good news is that we have a couple of simplifying constraints: We need monthly, location specific guidance relative to precipitation for producers, agricultural extension agents, and others involved with small to medium scale agriculture. To be useful in the near term, that guidance needs to be built using existing data and tools.
The Acid Test: Can we, or can we not, produce probabilistic monthly precipitation guidance for specific locations that is more reliable than the standard 30-year climatology, given data and tools currently in hand?
Klaus Wolter'sExperimental Climate Divisions http://www.cdc.noaa.gov/people/klaus.wolter/ClimateDivisions/
Klaus Wolter'sExperimental Climate Divisions Because these are based on precipitation variability, I will use these experimental climate divisions to define "location specific". http://www.cdc.noaa.gov/people/klaus.wolter/ClimateDivisions/
Century-scale monthly data from PRISM Select a grid point near the center of each experimental forecast division, and use the 103-year long PRISM time series data to define the decadal variations in precipitation. I will test different lengths of base record, de-trending options, and definitions of state and persistence. http://www.prism.oregonstate.edu/
NOAA/NCDC Coop Station Data Use individual station data to test the reliability of both the decadal and 30-year climatology as probabilistic forecasts over the last decade. Given the short period, use as many stations as possible within each experimental forecast division for the assessment.
Conceptually, this is so simple it can be done graphically for each month and experimental forecast division.But realistically,we will build assessment PoEsfrom the station data, and adapt ordevelop measures of relative reliability. More next year….
Jeanne Schneider jeanneschneider@mac.com Jeanne.Schneider@ars.usda.gov 405-884-2656