Download
1 / 31
320 likes | 545 Views
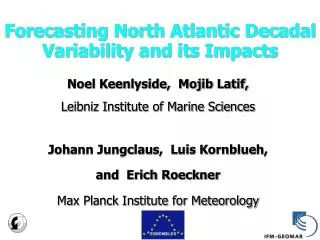
Modeling North Pacific Decadal Variations and Their Teleconnection Patterns. Speaker/ Pei-Ning Kirsten Feng Advisor/ Yu-Heng Tseng. Outline . Overview Motivation Objective Data and Model Ongoing / Future work Summary . North Pacific Decadal Variations.

E N D
Modeling North Pacific Decadal Variations and Their Teleconnection Patterns Speaker/ Pei-Ning Kirsten Feng Advisor/ Yu-Heng Tseng
Outline • Overview • Motivation • Objective • Data and Model • Ongoing / Future work • Summary
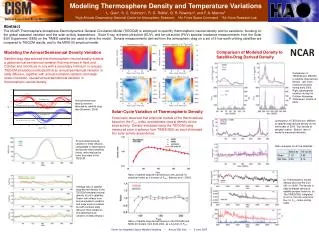
North Pacific Decadal Variations • The NPGO mode closely tracks the second EOF of North Pacific SSTa, also referred to as the "Victoria Mode”(Bond et al., 2003). The NPGO is distinct from the Pacific Decadal Oscillation (PDO) mode (Mantua et al., 1997), which emerges as the first mode of SSTa and SSHa in the Northeast Pacific. However the NPGO is the dominant mode for salinity and nutrients. [Di Lorenzo et al.,2008; Bond et al., 2003]
Pacific Decadal Variations PDO AREA [Di Lorenzo et al., 2008]
North Pacific – AL/PDO Warm Phase Cool Phase • The Pacific Decadal Oscillation (PDO) Index is defined as the leading principal component of North Pacific monthly sea surface temperature (SST) variability (poleward of 20N). [Mantua et al., 1997]
North Pacific – AL/PDO VIMONT et al., 2003
Why NPGO index • Recently it is found that PDO index can’t explain those variations in the ocean. However NPGO pattern is even more similar with them. Di Lorenzo et al., 2008
North Pacific – NPO/NPGO • North Pacific Gyre Oscillation, NPGO: • The NPGO is defined as the second dominant mode of SSHa variability in the Northeast Pacific [180°–110°W; 25°N–62°N] and is correlated with the second mode of North Pacific SSTa. [Di Lorenzo et al., 2008]
North Pacific – NPO/NPGO • The NPGO leads decadal variations in the strength of the Kuroshio-Oyashio connecting California and Japan. Di Lorenzo et al., 2008
NPO and ENSO Modoki • The dynamics that link ENSO to PDO are referred to as the ‘atmospheric bridge’12, whereby atmospheric teleconnectionsto the extratropics excited by ENSO project onto the atmospheric variability of the Aleutian Low, which then drives the ocean PDO pattern. Di Lorenzo et al., 2010
Atmosphere-Ocean Interaction [Di Lorenzo et al., 2010]
Teleconnection • Atlantic Patterns • Pacific Patterns • Global Patterns • Discussion
Atlantic Pattern -- NAO • The NAO is the dominant mode of winter climate variability in the North Atlantic region ranging from central North America to Europe and much into Northern Asia. The NAO is a large scale seesaw in atmospheric mass between the subtropical high and the polar low.
Pacific Pattern – NPO/WP • Orthogonally rotated principle component analysis(RPCA) of Northern Hemisphere 1-month mean 700 mb height is used. • The cold season West Pacific Oscillation has a strong center over or somewhat east of Kamchatka at 50-60°N, 160°E-170°W. [Barnston and Livezey, 1987]
Pacific Pattern – WP • The western pacific pattern (WP) is the SLP EOF2 pattern during DJFM in the region of 20~85N, 120E~120W.
Global Pattern -- AO • The AO is the dominant pattern of non-seasonal sea-level pressure (SLP) variations north of 20N, and it is characterized by SLP anomalies of one sign in the Arctic and anomalies of opposite sign centered about 37-45N. [Todd Mitchell , 2004 ]
Global Pattern -- AO • The loading pattern of AO is defined as the first leading mode from the EOF analysis of monthly mean height anomalies at 1000-hPa (NH). Year-round monthly mean anomaly data has been used to obtain the leading patterns.
Global Pattern and Teleconnection • AO • AL←→PDO • PNA • NAO • KOE • NPO ←→NPGO • WP • CPW • ENSO / EPW • How these oscillations play roles in the long term climate?
Motivation • Low-frequency oscillations are not known well. • Why there are so many decadal variations with similar patterns on time series? Are the related? • What might be the possible mechanism for those oscillations?
Objective • First we want to summarize the oscillations and determine their relations, especially stressed on the Pacific area. • We want to compare the model simulation to the observations and see if those oscillations are shown in the resolutions.
Methods and Model Data Source Model Methods
Data source • Hadley SST • 1º x 1º HadISST1 from 1900 to 2009. • Hadley SLP • 5º x 5º HadSLP2 from 1900 to 2009 • NCEP/NCAR Reanalysis 1 • 2.5º x 2.5º Reanalysis 500 Height from 1950 to 2009
Model( ECHAM5 / SIT / DIECAST ) Year: 1871 to 2008 ECHAM5– AGCM, running at various resolutions. SIT – a one-column snow/ice/ocean model with 41-level ocean+ 2-level ice + 2-level snow. DIECAST – OGCM with 2 degree in the equator, covering from 60°S to 60°N, with 31 levels. ECHAM (AGCM) 19 levels T31 SIT(Air/Snow/Ice/Thermocline) 2snow+2ice+41 water levels DIECAST (OGCM) 31 Levels (2 deg)
Ongoing / Future Work Ongoing Work Future Work
Ongoing / Future Work • Analysis of the model resolution