Download
1 / 53
910 likes | 2.12k Views
Plant Biochemistry. Hans-Walter Heldt in cooperation with Fiona Heldt. 1. A leaf cell consists of several metabolic compartments. Figure 1.1 Electron micrograph of mesophyll tissue from tobacco. In most cells the large central vacuole is to be seen (v).

E N D
PlantBiochemistry Hans-Walter Heldt in cooperation with Fiona Heldt
1 A leaf cell consists of severalmetabolic compartments
Figure 1.1 Electron micrograph of mesophyll tissue from tobacco. In most cells the large central vacuole is to be seen (v). Between the cells are the intercellular gas spaces (ig), which are somewhat enlarged by the fixation process. c: chloroplast, cw: cell wall, n: nucleus, m: mitochondrion. (By D. G. Robinson, Heidelberg.)
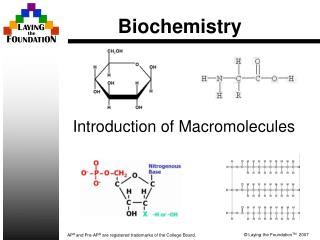
1.1 The cell wall gives the plant cellmechanical stability Figure 1.3 Main constituents of the cell wall. 1.3A. Cellulose
Figure 1.4 Ca++ and Mg++ ions mediate electrostatic interactions between pectin strands.
Figure 1.5 Cell wall of the green alga Oocystissolitaria. The cellulosemicrofibrils are arranged in a layer pattern, in which parallel layers are arranged one above the other. Freeze etching. (By D. G. Robinson, Heidelberg.)
Figure 1.6 Plasmodesmata connect neighboring cells to form a symplast . The extracellular spaces between the cell walls form the apoplast . Schematic representation. Each of the connections shown actually consists of very many neighboring plasmodesmata.
Figure 1.7 Diagram of a plasmodesm. The plasma membrane of the neighboring cells is connected by a tubelike membrane invagination. Inside this tube is a continuation of the endoplasmic reticulum. Embedded in the membrane of the ER and the plasma membrane are protein particles that are connected to each other. The spaces between the particles form the diffusion path of the plasmodesm. It is controversial whether a diffusion between the neighboring cells also takes place via the ER lumen. A. cross-sectional view of the membrane B. vertical view
1.3 Plastids have evolved from cyanobacteria Figure 1.8 A cyanobacterium forms a symbiosis with a host cell.
Figure 1.9 Plastids occur in various differentiated forms.A. Proplastid from young primary leaves of Cucurbitapepo (courgette);B. Chloroplast from mesophyll cell of tobaccoleaf fixed at the end of the dark period;
C. Leucoplast: amyloplast from the root of Cestrum auranticum; D. Chromoplast from petals also of C. auranticum. (By D. G. Robinson, Heidelberg.)
Figure 1.10 Scheme ofthe differentiation of a proplastid to a chloroplast
Figure 1.11 The granastacks of the thylakoidmembranes are connected by tubes, forming a continuous thylakoid space(thylakoid lumen). (After Weier and Stocking, 1963.)
1.5 Peroxisomes are the site of reactionsin which toxic intermediates are formed
Figure 1.13 In mitochondria inaginations of the inner membrane result in an enlargement of the membrane surface. The figure shows mitochondria in a barley aleurone cell. (By D. G. Robinson, Heidelberg.)
Figure 1.14 Peroxisomes. A. Peroxisomes from the mesophyll cells of tobacco. The proximity of peroxisome (P), mitochondrion (M), and chloroplast (C) reflects the rapid metabolite exchange between these organelles in the course of photorespiration (discussed in Chapter 7).
B. Glyoxysomes from germinating cotyledons of Cucurbitapepo (courgette).The lipid degradation described in section 15.6 and the accompanying gluconeogenesis require a close contact between lipid droplets (L), glyoxysome (G), and mitochondrion(M). (By D. G. Robinson, Heidelberg.)
1.6 The endoplasmic reticulum and Golgi apparatus form a network for the distribution of biosynthesis products
Figure 1.15 Roughendoplasmic reticulum, cross section (arrows) and tangential sections (arrowheads). The ribosomes temporarily attached to the membrane occur as polysome complexes (ribosome + mRNA). Section from the cell of a maturing peacotyledon. (By D. G. Robinson, Heidelberg.)
Figure 1.16 Scheme of the interplay between the endoplasmic reticulum and the Golgi apparatus in the transfer of proteins from the ER to the vacuoles and in the secretion of proteins from the cell.
Figure 1.17 Golgi apparatus (dictyosome) in the green alga Chlamydomonasreinhardii. C = cis side, t = trans side. Arrowheads point to the trans Golgi network. The swollen endoplasmatic reticulum (ER) is typical for this cell. On the ER, ribosomes can be recognized, except in the area where vesicles bud off. (By D. G. Robinson, Heidelberg.)
Figure 1.18 Model of the structure of clathrincoated vesicles.. (A) 3a and 3b subunits of clathrin form a complex with three arms. (B) From this a hexagonal and pentagonal lattice (the latter not shown here) is formed by polymerization and this forms (C) the coat. (From Kleinig and Sitte.)
1.7 Functionally intact cell organelles canbe isolated from plant cells
Figure 1.19 Protocol for the isolation of functionally intact chloroplasts.
Figure 1.20 Particles are separated by density gradient centrifugation according to their different densities
1.8 Various transport processes facilitate the exchange of metabolites between different compartments
1.9 Translocators catalyze the specific transport of substrates and products of metabolism
Figure 1.23 By measuring the concentration dependence of the rate of uptake for a substance it can be decided whether the uptake occurs by nonspecific diffusion through the membrane (A) or by specific transport (B).
Figure 1.24 Antiport.Diagram of twopossibilities for the counterexchangeof two substratemolecules (A, B). 1)Pingpongmechanism: Atranslocator molecule catalyzes the transport ofA and B sequentially. 2) Simultaneous mechanism:Aand B are transportedsimultaneously by two translocator moleculestightly coupled to each other.
Figure 1.25 Octylglucoside, a glycoside composed from a-Dglucose and octyl alcohol, is a mild nonionic detergent that allows membrane proteins to be solubilized from the membranes without being denatured.
Figure 1.26 The triosephosphate-phosphatetranslocator from spinach forms six transmembranehelices. Each circlerepresents one amino acid. The likely positions of the transmembrane helices were evaluated from the hydrophobicity of the single amino acid residues. The amino acids, markedwith red, containing apositive charge in helix 5, represent an arginine and a lysine. These amino acids probably provide the binding sites for the anionic substrates of the triose phosphate-phosphate translocator. (Data from Flügge et al., 1989.)
Figure 1.27 Measurement of ion channel currents by the “patch clamp” technique
Figure 1.28 Measurement of single channel currents of the K+ outward channel in a patch (Fig. 1.27) of the plasma membrane of guard cells from Viciafaba. (Outer medium 50mM K+, cytoplasmic side 200mM K+, voltage +35mV.) (Data from Prof. G. Thiel, Darmstadt.)
It has long been known that the channel protein is built from two identical subunits, each of which has two transmembrane helices connected by a sequence of about 30 amino acids (loop) (Fig. 1.29A).
Structure analysis showed that a K+ channel is built of four of these subunits (Fig. 1.29B, C).
Figure 1.31 With β-sheet conformation the amino acid residues of a peptide chain are arranged alternately in front of and behind the surface of the sheet.
Figure 1.32 Diagram of the structure of a membrane pore formed by a porin. Figure A shows the view from above
figure B shows a cross section through the membrane. Sixteen β-sheet sequences of the porin molecules, each 13 amino acids long, form the pore. The amino acid residues directed toward the membrane side of the pore have hydrophobic character; those directed to the aqueous pore are hydrophilic.