Download

1 / 8
80 likes | 156 Views
Preliminary Land use experiments. Potential vegetation. JULES vegetation spun up under 1958-1970 climate and pre-industrial carbon dioxide. The Experiments. Existing experiments Run ID • REMO (Vetter et al) CONTROL • REMO, CO 2 const (Harrison et al) CTL_CLIM

E N D
Potential vegetation • JULES vegetation spun up under 1958-1970 climate and pre-industrial carbon dioxide.
The Experiments Existing experiments Run ID • REMO (Vetter et al) CONTROL • REMO, CO2const (Harrison et al) CTL_CLIM New experiments • REMO, POTV POTV • REMO, POTV, CO2const P_CLIM • REMO, POTV, DGVM DGVM • REMO, POTV, DGVM, CO2const D_CLIM 1x1degree resolution used for all (= 0.25 resolution results but quicker to complete)
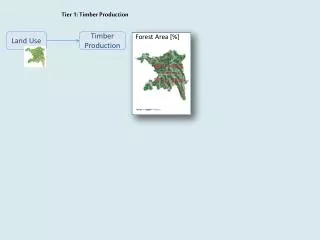
European Carbon Pool (Soil) • 1980-1989 • CONTROL = 118 Pg C • POTV = 73 Pg C • Plot range = 0-25 kg C m-2 POTV Control
European Carbon Pool (Vegetation) ∆SC = -45 Pg C ∆VC =16 Pg C • 1980-1989 • CONTROL = 33 Pg C • POTV = 49 Pg C • Plot range = 0-20 kg C m-2 POTV Control
Total carbon storage (1980-1989) • CONTROL = 151 Pg C • CTL_CLIM = 143 Pg C • POTV = 121 Pg C • P_CLIM = 115 Pg C • DGVM = 116 Pg C • D_CLIM = 110 Pg C • CONTROL-POTV (+30 Pg C) is therefore an estimate in the change in carbon storage resulting from land use change. • Expect large impact of management • Especially on soil C in crop areas • The impact of including dynamic vegetation is a small reduction in carbon storage (-5 Pg C).
Actual changes in carbon storage CONTROL 1.21 Pg C POTV 1.05 Pg C DGVM 1.07 Pg C CTL_CLIM -0.82 Pg C P_CLIM -0.48 Pg C D_CLIM -0.55 Pg C Changes scaled according to carbon pool size* CONTROL 1.21 Pg C POTV 1.31 Pg C DGVM 1.39 Pg C CTL_CLIM -0.87 Pg C P_CLIM -0.59 Pg C D_CLIM -0.76 Pg C ∆Carbon storage (90s-80s) * Assuming a linear sensitivity
Preliminary Conclusions • The impact of land use change is an increase in carbon storage in Europe (30 Pg C) • Don’t believe number (no land use) but indicative of sensitivity of system • All simulations indicate that CO2 fertilisation effects change Europe from a source to a sink. • Climate impact alone would cause C loss • Natural vegetation dynamics do not have a dominant impact on the carbon balance • though may be necessary for recovery after abandonment • Forced changes (land use) much more important