Download
1 / 1
10 likes | 113 Views
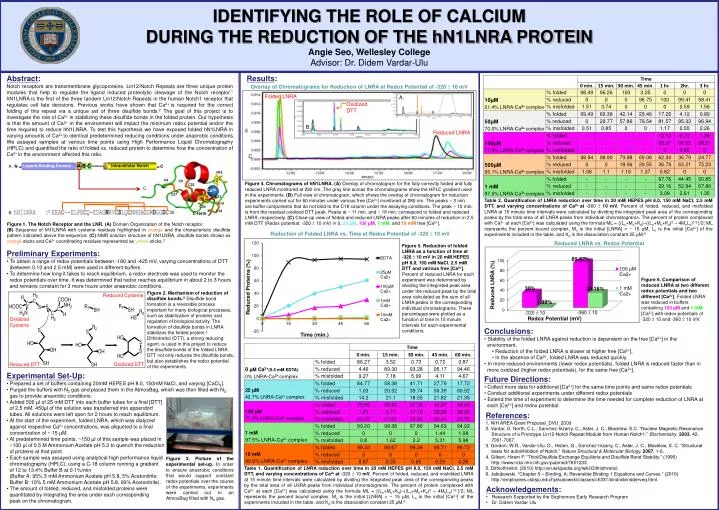
-360 ± 10. -320 ± 10. Redox Potential (mV). IDENTIFYING THE ROLE OF CALCIUM DURING THE REDUCTION OF THE hN1LNRA PROTEIN Angie Seo, Wellesley College Advisor: Dr. Didem Vardar-Ulu. Results :. Abstract :

E N D
-360 ± 10 -320 ± 10 Redox Potential (mV) IDENTIFYING THE ROLE OF CALCIUM DURING THE REDUCTION OF THE hN1LNRA PROTEIN Angie Seo, Wellesley College Advisor: Dr. Didem Vardar-Ulu Results: Abstract: Notch receptors are transmembrane glycoproteins. Lin12/Notch Repeats are three unique protein modules that help to regulate the ligand induced proteolytic cleavage of the Notch receptor.1 hN1LNRA is the first of the three tandem Lin12/Notch Repeats in the human Notch1 receptor that regulates cell fate decisions. Previous works have shown that Ca2+ is required for the correct folding of this repeat via a unique set of three disulfide bonds.2 The goal of this project is to investigate the role of Ca2+ in stabilizing these disulfide bonds in the folded protein. Our hypothesis is that the amount of Ca2+ in the environment will impact the minimum redox potential and/or the time required to reduce hN1LNRA. To test this hypothesis we have exposed folded hN1LNRA in varying amounts of Ca2+ to identical predetermined reducing conditions under anaerobic conditions. We assayed samples at various time points using High Performance Liquid Chromatography (HPLC) and quantified the ratio of folded vs. reduced protein to determine how the concentration of Ca2+ in the environment affected this ratio. Overlay of Chromatograms for Reduction of LNRA at Redox Potential of -320 ± 10 mV Folded LNRA A. Oxidized DTT B. Reduced LNRA C. N A. Figure 4. Chromatograms of hN1LNRA.(A) Overlay of chromatogram for the fully correctly folded and fully reduced LNRA monitored at 280 nm. The gray line across the chromatograms show the HPLC gradient used in the experiments. (B) Full view of chromatogram, which shows the overlay of chromatogram for reduction experiments carried out for 60 minutes under various free [Ca2+] monitored at 280 nm. The peaks ~ 3 min. are buffer components that do not bind to the C18 column under the assaying conditions. The peak ~ 10 min. is from the residual oxidized DTT peak. Peaks at ~ 11 min. and ~ 18 min. correspond to folded and reduced LNRA, respectively. (C) Close-up view of folded and reduced LNRA peaks after 60 minutes of reduction in 2.5 mM DTT (Redox potential: -320 ± 10 mV) in 0, 25 µM, 100 µM, 1 mM, and 10 mM free [Ca2+]. C. Table 2. Quantification of LNRA reduction over time in 20 mM HEPES pH 8.0, 150 mM NaCl, 2.5 mM DTT, and varying concentrations of Ca2+ at -360 ± 10 mV.Percent of folded, reduced, and misfolded LNRA at 15 minute time intervals were calculated by dividing the integrated peak area of the corresponding peaks by the total area of all LNRA peaks from individual chromatograms. The percent of protein complexed with Ca2+ at each [Ca2+] was calculated using the formula ML = {(Lo+Mo+Kd)–((Lo+Mo+Kd)2 – 4MoLo)1/2 }/2; ML represents the percent bound complex, Mo is the initial [LNRA] = ~ 15 µM, Lo is the initial [Ca2+] of the experiments included in the table, and Kd is the dissociation constant 25 µM.6 1 35 B. A B C Ligand Binding Domain C Intracellular Notch N15 Figure 1. The Notch Receptor and the LNR.(A) Domain Organization of the Notch receptor. (B) Sequence of hN1LNRA with cysteine residues highlighted in orange and the characteristic disulfide pattern indicated above the sequence. (C) NMR solution structure of hN1LNRA, disulfide bonds shown as orange sticks and Ca2+ coordinating residues represented as yellow sticks.3 C4 C9 C22 Reduction of Folded LNRA vs. Timeat Redox Potential of -320 ± 10 mV Ca2+ C27 D30 D33 Reduced LNRA vs. Redox Potential Figure 5. Reduction of folded LNRA as a function of time at -320 ± 10 mV in 20 mM HEPES pH 8.0, 150 mM NaCl, 2.5 mM DTT and various free [Ca2+]. Percent of reduced LNRA for each experiment was determined by dividing the integrated peak area under the reduced peak by the total area calculated as the sum of all LNRA peaks in the corresponding individual chromatograms. These percentages were plotted as a function of time in 15 minute intervals for each experimental conditions. S19 • Preliminary Experiments: • To obtain a range of redox potentials between -180 and -425 mV, varying concentrations of DTT • (between 0.10 and 2.5 mM) were used in different buffers. • To determine how long it takes to reach equilibrium, a redox electrode was used to monitor the • redox potentials over time. It was determined that redox reaches equilibrium in about 2 to 3 hours • and remains constant for 3 more hours under anaerobic conditions. • Experimental Set-Up: • Prepared a set of buffers containing 20mM HEPES pH 8.0, 150mM NaCl, and varying [CaCl2]. • Purged the buffers with N2 gas and placed them in the AtmosBag, which was then filled with N2 • gas to provide anaerobic conditions. • Added 500 µl of 25 mM DTT into each buffer tubes for a final [DTT] • of 2.5 mM. 450µl of the solution was transferred into eppendorf • tubes. All solutions were left open for 2 hours to reach equilibrium. • At the start of the experiment, folded LNRA, which was dialyzed • against respective Ca2+ concentrations, was aliquoted to a final • concentration of ~ 15 µM. • At predetermined time points, ~150 µl of this sample was placed in • ~100 µl of 0.5 M Ammonium Acetate pH 5.3 to quench the reduction • of proteins at that point. • Each sample was assayed using analytical high performance liquid • chromatography (HPLC), using a C-18 column running a gradient • of 12 to 13.4% Buffer B at 0.1%/min • (Buffer A: 95% 5 mM Ammonium Acetate pH 5.8, 5% Acetonitrile; • Buffer B: 10% 5 mM Ammonium Acetate pH 5.8, 90% Acetonitrile). • The amount of folded, reduced, and misfolded proteins were • quantitated by integrating the area under each corresponding • peak on the chromatogram. C34 C18 C-term Reduced Cysteine Figure 6. Comparison of reduced LNRA at two different redox potentials and two different [Ca2+]. Folded LNRA was reduced in buffers containing 100 µM and 1 mM [Ca2+] with redox potentials of -320 ± 10 and -360 ± 10 mV. Figure 2. Mechanism of reduction of disulfide bonds.5Disulfide bond formation is a reversible process important for many biological processes, such as stabilization of proteins and regulation of biological activity. The formation of disulfide bonds in LNRA stabilizes the folded protein.4 Dithiotreitol (DTT), a strong reducing agent, is used in this project to reduce the disulfide bonds of the folded LNRA. DTT not only reduces the disulfide bonds, but also establishes the redox potential of the experiments. Oxidized Cysteine • Conclusions: • Stability of the folded LNRA against reduction is dependent on the free [Ca2+] in the • environment. • Reduction of the folded LNRA is slower at higher free [Ca2+]. • In the absence of Ca2+, folded LNRA was reduced quickly. • In more reduced environments (lower redox potentials), folded LNRA is reduced faster than in • more oxidized (higher redox potentials), for the same free [Ca2+]. Oxidized DTT Reduced DTT • Future Directions: • Collect more data for additional [Ca2+] for the same time points and same redox potentials • Conduct additional experiments under different redox potentials • Extend the time of experiment to determine the time needed for complete reduction of LNRA at • each [Ca2+] and redox potential. References: 1. NIH AREA Grant Proposal_DVU_2009 2. Vardar, D. North, C.L., Sanchez-Irizarry, C., Aster, J. C., Blacklow, S.C. “Nuclear Magnetic Resonance Structure of a Prototype Lin12-Notch Repeat Module from Human Notch1.” Biochemistry. 2003, 42, 7061-7067. 3. Gordon, W.R., Vardar-Ulu, D., Histen, G., Sanchez-Irizarry, C., Aster, J. C., Blacklow, S. C. “Structural basis for autoinhibition of Notch.” Nature Structural & Molecular Biology.2007, 1-6. 4. Gilbert, Hiram F. “Thiol/Disulfide Exchange Equilibria and Disulfide Bond Stability.” (1995) http://www.ncbi.nlm.nih.gov/pubmed/7651233. 5. Dithiothreitol. (2010) http://en.wikipedia.org/wiki/Dithiothreitol. 6. Jakubowski. “Chapter 5 – Binding. A: Reversible Binding 1 Equations and Curves.” (2010) http://employees.csbsju.edu/hjakubowski/classes/ch331/bind/olbindderveq.html. Figure 3. Picture of the experimental set-up. In order to ensure anaerobic conditions that would support constant redox potentials over the course of the experiments, experiments were carried out in an AtmosBag filled with N2 gas. Table 1. Quantification of LNRA reduction over time in 20 mM HEPES pH 8.0, 150 mM NaCl, 2.5 mM DTT, and varying concentrations of Ca2+ at -320 ± 10 mV.Percent of folded, reduced, and misfolded LNRA at 15 minute time intervals were calculated by dividing the integrated peak area of the corresponding peaks by the total area of all LNRA peaks from individual chromatograms. The percent of protein complexed with Ca2+ at each [Ca2+] was calculated using the formula ML = {(Lo+Mo+Kd)–((Lo+Mo+Kd)2 – 4MoLo)1/2 }/2; ML represents the percent bound complex, Mo is the initial [LNRA] = ~ 15 µM, Lo is the initial [Ca2+] of the experiments included in the table, and Kd is the dissociation constant 25 µM.6 • Acknowledgements: • Research Supported by the Sophomore Early Research Program • Dr. Didem Vardar Ulu