Download
1 / 34
340 likes | 567 Views
Chapter 2. Maps as Models of the Earth. Table of Contents. Section 1 You Are Here Section 2 Mapping the Earth’s Surface Section 3 Topographic Maps. Section 1 You Are Here. Chapter 2. Bellringer.

E N D
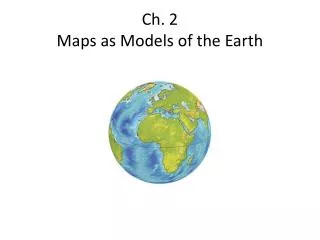
Chapter 2 Maps as Models of the Earth Table of Contents Section 1 You Are Here Section 2 Mapping the Earth’s Surface Section 3 Topographic Maps
Section1 You Are Here Chapter 2 Bellringer Draw a map from your home to one of your favorite places. Clearly label all landmarks and include information that might be useful to someone using the map. Draw your map in your science journal.
Section1 You Are Here Chapter 2 Objectives • Explain how a magnetic compass can be used to find directions on Earth. • Explain the difference between true north and magnetic north. • Compare latitude and longitude. • Explain how latitude and longitude are used to locate places on Earth.
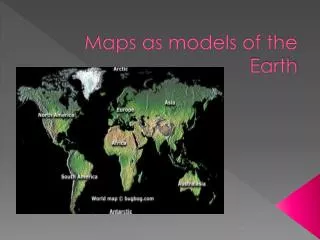
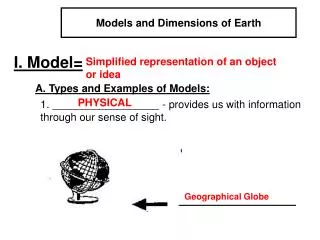
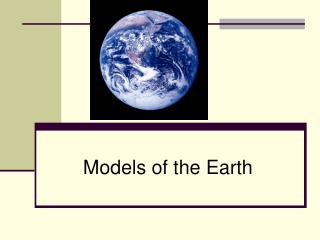
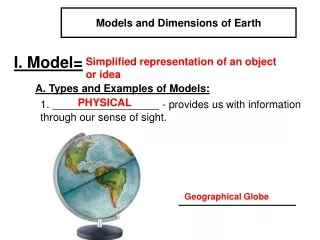
Section1 You Are Here Chapter 2 What Does Earth Really Look Like? • Amapis a representation of the features of a physical body such as Earth. • The Greeks thought of Earth as a sphere almost 2,000 years before Columbus sailed in 1492. • Around 240 BCE, Greek mathematician Eratosthenes calculated the circumference of the Earth. His calculation was wrong by only 6,250 km.
Section1 You Are Here Chapter 2 Finding Direction on Earth • A reference point is a fixed place on the Earth’s surface from which direction and location can be described. The North and South Poles are used as reference points on the Earth. • Cardinal Directionsare the directions north, south, east, and west. Using cardinal directions is more precise than using directions such as “right” or “left.”
Section1 You Are Here Chapter 2
Section1 You Are Here Chapter 2 Finding Direction on Earth, continued • Using a CompassA compass is a tool that uses the natural magnetism of the Earth to show direction. A compass needle points to the magnetic north pole. • Earth has two different sets of poles—the geographic poles and the magnetic poles.
Section1 You Are Here Chapter 2 Finding Locations on the Earth • Latitudeis the distance north or south of the equator. Theequatoris a circle halfway between the North and South Poles that divides the Earth into the Northern and Southern Hemispheres. • Lines of latitude are parallel to the equator. • Latitude is expressed in degrees.
Section1 You Are Here Chapter 2 Finding Locations on the Earth, continued • Longitudeis the distance east and west of the prime meridian. Theprime meridianis the line that represents 0º longitude. It runs from the North Pole, through Greenwich, England, to the South Pole. • Lines of longitude are not parallel. They touch at the poles and are farthest apart at the equator. • Longitude is also expressed in degrees.
Section1 You Are Here Chapter 2
Section1 You Are Here Chapter 2 Finding Locations on the Earth, continued • Using Latitude and LongitudeLines of latitude and lines of longitude cross and form a grid system on globes and maps. This grid system can be used to find locations on the Earth’s surface.
Chapter 2 Section2 Mapping the Earth’s Surface Bellringer Compare a world map, a state map, and a city map. Make a chart that lists the similarities and differences between each map. Then, write three possible uses for each map. Finally, write three improvements that could be made to each map. Write your answer in your science journal.
Chapter 2 Section2 Mapping the Earth’s Surface Objectives • Explain Why maps of the Earth show distortion. • Describe four types of map projections. • Identify five pieces of information that should be shown on a map. • Describe four methods modern mapmakers use to make accurate maps.
Chapter 2 Section2 Mapping the Earth’s Surface A Flat Sphere? • A map is a flat representation of the Earth’s curved surface. When you move information from a curved surface to a flat surface, you lose some accuracy. • Changes called distortions happen in shapes and sizes of landmasses and oceans on map. Direction and distance can also be distorted.
Chapter 2 Section2 Mapping the Earth’s Surface A Flat Sphere?, continued • Map ProjectionsMapmakers use map projections to move the image of Earth’s curved surface onto a flat surface. To understand how map projections are made, think a translucent globe that has a light inside. • If you hold a piece of paper against the globe, shadows of marks on the globe appear on the paper. The way the paper is held against the globe determines the kind of map projection that is made.
Chapter 2 Section2 Mapping the Earth’s Surface A Flat Sphere?, continued • Acylindrical projectionis a map projection that is made by moving the surface features of the globe onto a cylinder. The most common cylindrical projection is called a Mercator projection. • A Mercator projection is accurate near the equator, but areas near the poles look wider and longer on the map than they look on the globe.
Chapter 2 Section2 Mapping the Earth’s Surface A Flat Sphere?, continued • Aconic projectionis a map projection that is made by moving the surface features of the globe onto a cone. The cone touches the globe at each line of longitude but at only one line of latitude. • There is no distortion along the line of latitude where the globe touches the cone. Areas near this line of latitude are distorted less than other areas are.
Chapter 2 Section2 Mapping the Earth’s Surface A Flat Sphere?, continued • Anazimuthal projectionis a map projection that is made by moving the surface features of the globe onto a plane. The plane touches the globe at only one point. • The point of contact is usually one of the poles. There is little distortion at the point of contact. However, distortion increases as you move away from the point of contact.
Chapter 2 Section2 Mapping the Earth’s Surface A Flat Sphere?, continued • Equal-Area ProjectionsAmap projection that shows the area between latitude and longitude lines the same size as that area on a globe is called an equal-area projection. • The shapes of the continents and oceans are distorted on equal-area projections. However, these projections are good for determining distance.
Chapter 2 Section2 Mapping the Earth’s Surface
Chapter 2 Section2 Mapping the Earth’s Surface Information Shown on Maps • Maps should have a title, a compass rose, a scale, a legend, and a date. • Unfortunately, not all maps have all this information. The more of this information a map has, the more reliable the map is.
Chapter 2 Section2 Mapping the Earth’s Surface Modern Mapmaking • Remote sensingis a way to collect information about something without physically being there. • Remote Sensing and Satellites Remote sensors on satellites gather data about energy coming from Earth’s surface and send the data back to receiving stations on Earth.
Chapter 2 Section2 Mapping the Earth’s Surface Modern Mapmaking, continued • Remote Sensing and Radar Radar is a tool that uses waves of energy to map Earth’s surface. • The global positioning system (GPS) is a system of orbiting satellites that send radio signals to receivers on Earth. The receivers calculate latitude, longitude, and elevation. • A geographic information systems (GIS) is a computerized system that allows a user to enter different types of information about an area.
Section3 Topographic Maps Chapter 2 Bellringer Examine the topographic map on page 54 of your textbook. Imagine that you are standing on the top of Campbell Hill. Describe what you see in each direction. Write your description in your science journal.
Section3 Topographic Maps Chapter 2 Objectives • Explain how contour lines show elevation and landforms on a map. • Explain how the relief of an area determines the contour interval used on a map. • List the rules of contour lines.
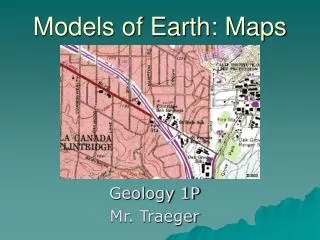
Section3 Topographic Maps Chapter 2 Elements of Elevation • Atopographic mapis a map that shows surface features, or topography, of the Earth. Topographic maps show natural and human-made features. • Topographic maps also show elevation.Elevationis the height of an object above sea level. The elevation at sea level is 0.
Section3 Topographic Maps Chapter 2 Elements of Elevation, continued • Contour Linesare lines that connect points of equal elevation. Topographic maps use contour lines to show elevation. • Contour Intervalis the difference in elevation between one contour line and the next.Reliefis the difference in elevation between the highest and lowest points of the area being mapped. Relief is used to determine the contour interval of a map.
Section3 Topographic Maps Chapter 2 Elements of Elevation, continued • The spacing of contour lines indicate slope. Contour lines that are close together show a steep slope. Contour lines that are far apart show a gentle slope. • An index contour is a darker, heavier line that is usually every fifth line and that is labeled by elevation.
Section3 Topographic Maps Chapter 2 Reading a Topographic Map • Topographic maps use symbols to represent parts of the Earth’s surface. Colors are also used to represent features. For example, cities and towns are pink, bodies of water are blue, and wooded areas are green. • The Golden Rules of Contour LinesThe next slide explains four rules that will help you understand how to read topographic maps.
Section3 Topographic Maps Chapter 2 Contour Lines: The Golden Rules Click below to watch the Visual Concept. You may stop the video at any time by pressing the Esc key. Visual Concept
Maps as Models of the Earth Chapter 2 Concept Map Use the terms below to complete the concept map on the next slide.
Maps as Models of the Earth Chapter 2
Maps as Models of the Earth Chapter 2