Download
1 / 50
500 likes | 623 Views
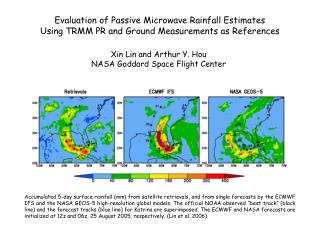
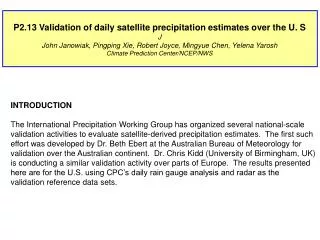
Validation of Satellite Rainfall Estimates over the Mid-latitudes. Chris Kidd University of Birmingham, UK. 2 nd IPWG working group workshop, Monterey, CA. 25-28 October 2004. The European Context. Geographically diverse Large extent of coastlines and interiors Plains & mountains

E N D
Validation of Satellite Rainfall Estimates over the Mid-latitudes Chris Kidd University of Birmingham, UK
2nd IPWG working group workshop, Monterey, CA. 25-28 October 2004 The European Context Geographically diverse • Large extent of coastlines and interiors • Plains & mountains • Variable background – snow cover, sand etc. Meteorologically diverse – hence climatologically • Maritime and continental influences • Stratiform vs convective precipitation • Seasonal variations – frigid vs stifling temperatures Plenty of light rain intensities…
Raw Data ECMWF IR PMW CPCMW CMORPH European radar data 3B40 3B41 3B42 Data processing Data Products Validation Data PMIR GPI FDA Remap data to PSG Statistics at 20km and 50km Production of web pages 2nd IPWG working group workshop, Monterey, CA. 25-28 October 2004 Data processing
2nd IPWG working group workshop, Monterey, CA. 25-28 October 2004 Results generation Visual analysis • Imagery of observations and estimates • Descriptive statistics • Contingency tables, conditional rain rates • Statistical analysis • Bias, ratio, RMSE, Correlation, Heidke score etc • In addition: • Cumulative distribution of accumulation • Analysis of occurrence of precipitation • Cumulative distribution of occurrence by intensities
2nd IPWG working group workshop, Monterey, CA. 25-28 October 2004 21-day moving average
2nd IPWG working group workshop, Monterey, CA. 25-28 October 2004 Ratio of occurrence >0 (21-day)
2nd IPWG working group workshop, Monterey, CA. 25-28 October 2004 Ratio of occurrence >1 (21-day)
2nd IPWG working group workshop, Monterey, CA. 25-28 October 2004 Rainfall ratio (21-day)
2nd IPWG working group workshop, Monterey, CA. 25-28 October 2004 Heidke Score >=0 (21-day)
2nd IPWG working group workshop, Monterey, CA. 25-28 October 2004 Initial results • Satellite observations show significant seasonality • Rainfall occurrence is underestimated, except by the ECMWF model reanalysis (resolution?) • Model results suggest an element of inconsistency • Day-to-day variations in performance are large and…
2nd IPWG working group workshop, Monterey, CA. 25-28 October 2004 Future strategy Broaden range of algorithms/products • (more please!) Back-date study as far as possible • (radar/gauge and algorithm radar) Include other radar data where available • (Baltex, Spain, Italy?) Incorporate gauge data when available • (available <1999 for UK, European?) BUT….
2nd IPWG working group workshop, Monterey, CA. 25-28 October 2004 Light rainfall detection • An algorithm with a rain/no-rain boundary of 1mm/hr should underestimate the rainfall by the contribution of rainfall below 1mm/hr • Algorithms that cannot identify all the rain should underestimate rainfall totals • Algorithms that are bias-corrected must compensate the lack of light-rainfall contribution with rainfall at higher intensities – i.e. they will underestimate the low rainfall and overestimate high rainfall. • (In reality algorithms might detect some light rain, but not all)
2nd IPWG working group workshop, Monterey, CA. 25-28 October 2004 “Ideal” algorithms All algorithms produce identical results to any validation data set… radar e40 3B40 3B41 3B42 Accumulation
2nd IPWG working group workshop, Monterey, CA. 25-28 October 2004 … reality Algorithms tend to be tuned to minimise the longer-term biases – but are they ‘correct’? 3B40 radar e40 3B41 3B42 Accumulation
2nd IPWG working group workshop, Monterey, CA. 25-28 October 2004 Rainfall accumulation The make-up of the ‘intensities’ to the total is of critical importance: 3B40 radar e40 3B41 3B42 Accumulation
2nd IPWG working group workshop, Monterey, CA. 25-28 October 2004 Rainfall accumulation The make-up of the ‘intensities’ to the total is very important: 3B40 radar e40 3B41 3B42 Accumulation
2nd IPWG working group workshop, Monterey, CA. 25-28 October 2004 Accumulation of precipitation Jan 2004 Feb 2004 Mar 2004 Radar e40 3B40 3B41 3B42 Radar e40 3B40 3B41 3B42 Radar e40 3B40 3B41 3B42 Apr 2004 May 2004 Jun 2004
2nd IPWG working group workshop, Monterey, CA. 25-28 October 2004 Occurrence of precipitation Jan 2004 Feb 2004 Mar 2004 Radar e40 3B40 3B41 3B42 Radar e40 3B40 3B41 3B42 Radar e40 3B40 3B41 3B42 Apr 2004 May 2004 Jun 2004
2nd IPWG working group workshop, Monterey, CA. 25-28 October 2004 Accumulation of precipitation <1 mm/hr <2 mm/hr
2nd IPWG working group workshop, Monterey, CA. 25-28 October 2004 Occurrence of precipitation <1 mm/hr <2 mm/hr
mean rainrates mean rainrates > thresholds Generate ‘global’ ratio Bias (ratio) correct mean rainrates Plot grid-sized ratios Rain/no-rain induced biases TRMM 2A25 data
-4.0 -2.0 -0.5 -1.0 2nd IPWG working group workshop, Monterey, CA. 25-28 October 2004 Rain/no-rain induced biases • Differences in rain/no-rain boundaries reveal regional variations that do not exist in reality • Further complicated since rain/no-rain boundaries tend to differ over land/sea areas
Recommendations • There is a need to identify regions over which climate change can be observed with a high degree of confidence • Parameters need to be chosen that can be retrieved with a high degree of confidence – basic ones means that the causes of changes can be understood • Cross-talk between parameters needs to be reduced as much as possible • Long-term changes need to consider RFI contamination, particularly for coastal regions
2nd IPWG working group workshop, Monterey, CA. 25-28 October 2004 Processing steps… Data acquisition Data processing Day-01 3B40 3B41 3B42 Day-02 Radar Day-03 SSM/I Global-IR Global-IR GPI Day-04 UoB PMIR Day-… SSM/I UoB FDA Day-20 ECMWF
2nd IPWG working group workshop, Monterey, CA. 25-28 October 2004 Are satellite rainfall algorithms correct? In one word, no. Why? General assumption that long-term rainfall amounts should be ‘correct’ - biases between validation and algorithm can be (and are) removed through bias-correction or ‘adjustments’ However, algorithms have ‘minimum detectable’ thresholds – i.e. the rain/no-rain boundary
2nd IPWG working group workshop, Monterey, CA. 25-28 October 2004 Implications • Current hydrological models that rely upon satellites estimates will be incorrect. Moreover, hydrological models treat different rainfall intensities differently • Climate change scenarios are varied, but imply that there will be a change in the distribution of rainfall intensities. If satellite estimates are already biased can we honestly detect these change – yet alone quantify them?
2nd IPWG working group workshop, Monterey, CA. 25-28 October 2004 Conclusions Care needs to be taken when producing ‘correct’ results: In terms of rain occurrence (or area): • Algorithms underestimate occurrence/extent by about half. • Most of this occurs at light rainfall < 2mm/hr In terms of rain accumulation • Although the light rainfall contribution relatively small, it is critical in obtaining spatial variations in rainfall correct http://kermit.bham.ac.uk/~kidd/ipwg_eu/ipwg_eu.html
0.5-1 128+ 64-128 0.0-0.5 32-64 16-32 8-16 4-8 2-4 1-2 2nd IPWG working group workshop, Monterey, CA. 25-28 October 2004 Occurrence of precipitation by intensity
2nd IPWG working group workshop, Monterey, CA. 25-28 October 2004 Rainfall occurrences radar 3B41 3B42 April 2004 e40 3B40
2nd IPWG working group workshop, Monterey, CA. 25-28 October 2004 Data sets • European radar data: 5km polar stereographic projection (equal area) • ECMWF e40 reanalysis: nominally 1.125*x1.125 degree resolution • 3B40 combinedMicro: 0.5x0.5 degree • 3B41 calibratedIR: 0.5x0.5 degree • 3B42 mergeIRMicro: 0.5x0.5 degree • CPC microwave product • CMORPH combined IR/MW product • Model and satellite data remapped to radar data (20km and 50km), and compared on a daily time scale.