Download
1 / 16
160 likes | 253 Views
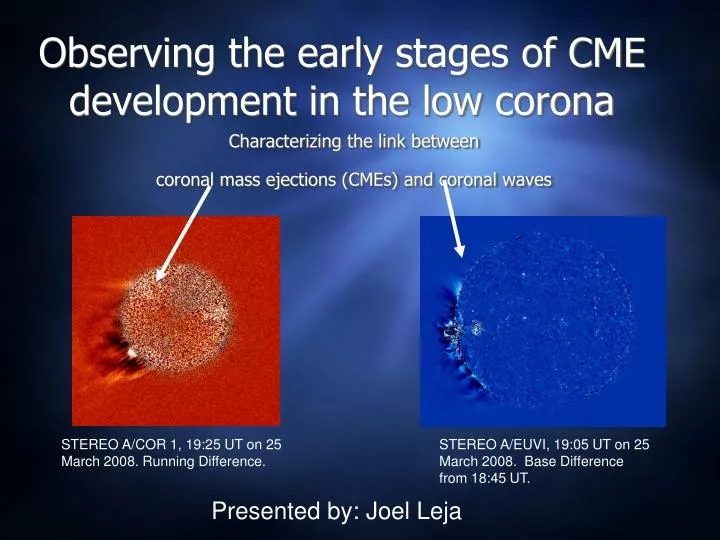
Observing the early stages of CME development in the low corona. Characterizing the link between coronal mass ejections (CMEs) and coronal waves. STEREO A/COR 1, 19:25 UT on 25 March 2008. Running Difference. STEREO A/EUVI, 19:05 UT on 25 March 2008. Base Difference from 18:45 UT.

E N D
Observing the early stages of CME development in the low corona Characterizing the link between coronal mass ejections (CMEs) and coronal waves STEREO A/COR 1, 19:25 UT on 25 March 2008. Running Difference. STEREO A/EUVI, 19:05 UT on 25 March 2008. Base Difference from 18:45 UT. Presented by: Joel Leja
Solar Corona • Part of solar atmosphere; Hot, tenuous (~109 cm-3) plasma superheated to ~106 K. • Plasma ~0.1 (plasma motion is dominated by magnetic field) • Most information is derived from emission lines of highly ionized atoms • The 195 Å line, where coronal waves are best viewed, is emitted by Fe XII and represents a temperature of ~1.6 x 10⁶ K Image courtesy of NASA
STEREO spacecraft Instruments • Two identical satellites • One trails behind and one pulls ahead of the Earth’s orbit • Allow a “stereoscopic” view of solar eruptions • EUVI (195 Å) -Extreme Ultraviolet Imager -FOV: 0-1.7 R -Images the low corona -~5-10 minute cadence • COR 1 -occulting white-light coronagraph -FOV: 1.3-4 R -primarily for CME detection -~5-10 minute cadence Image courtesy of NASA
Coronal Mass Ejections • Violent expulsions of plasma and magnetic flux from the Sun -Typically release 1015 grams of plasma/1030 ergs of kinetic energy, according to the LASCO/CDAW catalogue. -Frequency depends on stage in solar cycle; once every other day during minimum, 5-6 times a day during maximum. • Observations indicate CMEs can originate in an erupting magnetic flux rope. -Magnetic flux present on the order of 1020 Mx. Running difference STEREO B/COR 1 movie of the 25 March 2008 eruption.
Coronal Waves • First observed in 1997 by EIT aboard SOHO in 195 Å (Dere et al., 1997; Thompson et al., 1998) • Expanding bright front from some source, usually an active region. • Appears to cause persistent, stationary dimmings and brightenings. (Delannèe, 2000; Attrill et al., 2007) Observational Characteristics -Semi-isotropic expansion -Speeds of 25-438 km/s (Thompson & Meyers, 2009; Wills-Davey et al., 2007) -Primarily observed in the quiet Sun corona; blocked by active regions -Observed at height of ~1.1 R (Patsourakos et al., 2009) Movies: Base difference, STEREO A/B (top/bottom) EUVI, eruption of 26 April 2008, 13:35-15:15 UT
Image Processing Raw Image Base Difference RunningDifference -Data directly from the CCD -No higher-level processing necessary -A pre-event image is subtracted from each frame -Highlights real brightenings and dimmings -The previous frame is subtracted from the current frame -Highlights changes between frames STEREO B/EUVI data taken on 13 February 2009, 15:05-16:35 UT
Coronal Wave Models Wave models (CME or flare-driven) • Fast-mode MHD wave (e.g. Thompson et al., 1999; Cliver et al., 1999; Wang, 2000; Wu et al., 2001; Vršnak et al., 2002; Warmuth et al., 2004) -can propagate perpendicular to magnetic field • Slow-mode MHD wave (e.g. Krasnoselskikh & Podladchikova, 2007; Wang et al., 2009) -must travel at an oblique angle to magnetic field • Solitary slow-mode MHD wave (Wills-Davey et al., 2007) Non-wave models (CME driven) • Plasma compression due to stretching of the overlying magnetic field (Delanée & Aulanier, 1999; Chen et al., 2002, 2005; Chen, 2009) • A series of current-shells form around the erupting flux rope (Delanée et al., 2008) • Magnetic reconnection occuring between favorably oriented quiet-Sun magnetic field and the expanding CME flanks (Attrill et al., 2007)
A link between CMEs and coronal waves? Biesecker et al. (2002) performed a large-scale statistical study evaluating the link between coronal waves and (I) CMEs; (II) flares; and (III) type-II radio bursts Result: For every coronal wave, there is an associated CME (not every CME has a coronal wave, however!) The exact nature of this CME/coronal wave relationship is pivotal to the success of coronal wave models, yet currently, it remains elusive.
Where does the intern come in? Project Goal Correlation of CME flank expansion (which is not well-studied, in general) to the propagation of the coronal wave and the spatial extent of associated coronal dimmings Project Outline • CACTus (Robbrecht, 2007), an automated CME tracker, was used to search between March 2008 and May 2009 for large-scale CMEs in STEREO COR1 data. • STEREO EUVI data was then examined for a corresponding coronal wave. • A list of 23 large-scale events was compiled. • 4 representative events were chosen for a case study. Only 3 events, however, are included in this presentation.
Composites A series of COR1/EUVI composite movies are formed for each event -The blocked area of the coronagraph is “filled in” with images of the disc. -Allows for study of the link between lower and upper corona -FESTIVAL software is generally used for this task; however, it is incompatible with base difference images Upper left: STEREO A, eruption of 05 April 2008. Running difference. Lower left: STEREO A, eruption of 25 March 2008. Running difference. Lower right: STEREO A, eruption of 13 February 2009. Running difference.
Angular Diameter Quantization of the findings in the composite movies. The maximum angular extent of the coronal wave is compared to the maximum lateral extent of the CME. -Error bars represent the “width” of the diffuse bright front. -Data is taken until (I) the CME flanks become too ill-defined or (II) both the CME and coronal wave stop showing appreciable expansion Upper left: 05 April 2008. CME and coronal wave appear to be decoupled. Lower left: 25 March 2008. CME and coronal wave appear to be strongly coupled. Lower right: 13 February 2009. CME and coronal wave appear to be coupled until 6:25, then a decoupling occurs.
Coronal Dimmings Physical Causes -Decrease in number density (via plasma outflow) -Change in temperature (taking it out of the range of bandpass sensitivity) Defined in detection algorithm to be a decrease in emission by more than one sigma below the mean value of the entire pre-event base difference image. “Secondary” dimming Base difference STEREO A/EUVI stills from 13 February 2009 eruption. 05:15 UT on left, 08:35 UT on right. Coronal dimmings associated with CMEs have been proven, in case studies, to be associated with plasma outflow (Harra and Sterling, 2001; Harra et al., 2007). “Core” dimming
Dimmings Analysis An algorithm (Attrill & Wills-Davey, 2009) identified regions of coronal dimming and a composite was formed with the “maximum” extent of the CME in each event. -In theory, magnetic reconnection -----> “open” field lines -----> plasma outflow -----> coronal dimmings. -To explore this, the correlation of the secondary dimmings to the extent of the CME was examined. All images: data from STEREO A. COR 1 is running difference; solar disc is location of dimmings marked by algorithm. Upper left: 05 April 2008 Lower left: 25 March 2008 Lower right: 13 February 2009
Conclusions • One case study shows a strong link to expanding CME flanks; another seems consistent with interpretation as a fast-mode MHD wave; a third shows signs of links to both. Why? Perhaps more than one physical process occurs in any given event (Zhukov & Auchére, 2004; Cohen et al.,2009) An avenue for future research? Two frames from the 25 March 2008 eruption showing two distinct types of coronal “wave”.
Importance -Understand and, hopefully, someday predict the magnetic orientation of CMEs to prepare for geomagnetic storms and space weather. Image courtesy of National Geographic
Thank You! • Gemma (for everything) • Kelly and Trae (for making this all possible!) • Everyone else for their patience in enduring ~6-7 hours of presentations!