Download
1 / 3
30 likes | 149 Views
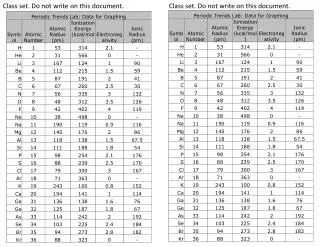
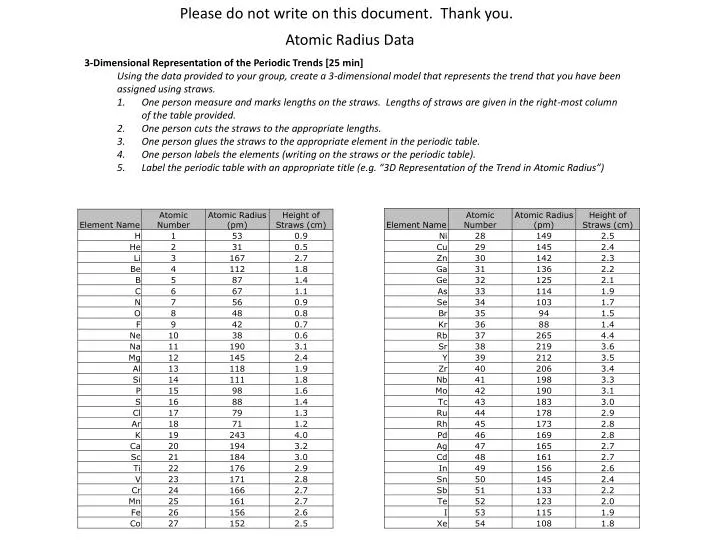
Please do not write on this document. Thank you. Atomic Radius Data. 3-Dimensional Representation of the Periodic Trends [25 min] Using the data provided to your group, create a 3-dimensional model that represents the trend that you have been assigned using straws.

E N D
Please do not write on this document. Thank you. Atomic Radius Data • 3-Dimensional Representation of the Periodic Trends [25 min] • Using the data provided to your group, create a 3-dimensional model that represents the trend that you have been assigned using straws. • One person measure and marks lengths on the straws. Lengths of straws are given in the right-most column of the table provided. • One person cuts the straws to the appropriate lengths. • One person glues the straws to the appropriate element in the periodic table. • One person labels the elements (writing on the straws or the periodic table). • Label the periodic table with an appropriate title (e.g. “3D Representation of the Trend in Atomic Radius”)
Please do not write on this document. Thank you. Ionization Energy Data • 3-Dimensional Representation of the Periodic Trends [25 min] • Using the data provided to your group, create a 3-dimensional model that represents the trend that you have been assigned using straws. • One person measure and marks lengths on the straws. Lengths of straws are given in the right-most column of the table provided. • One person cuts the straws to the appropriate lengths. • One person glues the straws to the appropriate element in the periodic table. • One person labels the elements (writing on the straws or the periodic table). • Label the periodic table with an appropriate title (e.g. “3D Representation of the Trend in Atomic Radius”)
Please do not write on this document. Thank you. Electronegativity Data • 3-Dimensional Representation of the Periodic Trends [25 min] • Using the data provided to your group, create a 3-dimensional model that represents the trend that you have been assigned using straws. • One person measure and marks lengths on the straws. Lengths of straws are given in the right-most column of the table provided. • One person cuts the straws to the appropriate lengths. • One person glues the straws to the appropriate element in the periodic table. • One person labels the elements (writing on the straws or the periodic table). • Label the periodic table with an appropriate title (e.g. “3D Representation of the Trend in Atomic Radius”)