Download
1 / 48
550 likes | 914 Views
Importance of early glycemic control in management of type 2 diabetes. Prof. Khalifa M. Abdallah Professor of Internal Medicine Unit of Diabetes & Metabolic Diseases Alexandria Faculty of Medicine. Overview. The importance of early and sustained glycemic control

E N D
Importance of early glycemic control in management of type 2 diabetes Prof. Khalifa M. Abdallah Professor of Internal Medicine Unit of Diabetes & Metabolic Diseases Alexandria Faculty of Medicine
Overview • The importance of early and sustained glycemic control • The rationale for early insulinization • Advantages of basal insulin therapy • Take home message
Diabetes MellitusA Constellation of Complications Renal Disease Erectile Dysfunction Peripheral Neuropathy Peripheral Vascular Disease Retinopathy/ Macular Edema Gastropathy Autonomic Neuropathy Dyslipidemia Hypertension Cardiovascular Disease Diabetes
- A1c & MicrovascularComplications60 – 70 % Reduction of Complications Retinopathy 15 Nephropathy 13 11 9 Neuropathy Relative Risk 7 5 Microalbuminuria 3 1 6 7 8 9 10 11 12 HbA1c (%) Skyler JS. Endocrinol Metab Clin. 1996;25:243–254.
80 Onset 76% Progression 60 60% 54% 54% 40 39% 20 0 albuminuria Albuminuria Neuropathy Retinopathy Risk Reduction in DCCT Effects of reduction of A1c by 1.9% in intensively treated group Risk Reduction P=0.002 P=0.04 P=0.002 P=0.04 P=0.002 DCCT Research Group. N Engl J Med. 1993;329:977-986.
A1c : Myocardial Infarction and Microvascular Complication 80 Microvasculardisease 60 Myocardialinfarction Incidence per1000 patient-years 40 20 Mean HbA1c (%) 0 0 5 6 7 8 9 10 11 UKPDS 35. BMJ 2000; 321: 405-12.
UKPDS: Glucose Control Study Summary The intensive glucose control policy maintained a lower HbA1c by a mean of 0.9% over a median follow up of 10 years from diagnosis of type 2 diabetes with reduction in risk of: 12% for any diabetes related endpoints p=0.029 25% for microvascular endpoints p=0.0099 16% for myocardial infarction p=0.052
UKPDS: Glucose Control Study Summary The intensive glucose control policy maintained a lower HbA1c by a mean of 0.9% over a median follow up of 10 years from diagnosis of type 2 diabetes with reduction in risk of: 12% for any diabetes related endpoints p=0.029 25% for microvascular endpoints p=0.0099 16% for myocardial infarction p=0.052
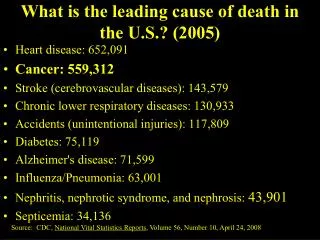
Causes of Death in People With Diabetes 65% 50 of Diabetic Patients Deaths are from CV Causes Deaths (%) 40 40 30 20 15 13 13 10 10 5 4 0 All other Malignant neoplasms Diabetes Other heart disease Pneumonia/ influenza Ischemic heart disease Cerebrovascular disease WHO Report 1997. World Health Organisation. Geneva 1997
Can long-term glycemic control reduce the risk of cardiovascular disease?
ACCORD ADVANCE and VADT- No Significant Effect on Macro or Micro Vascular Outcomes
DCCT / EDIC: majority of patients receive intensive therapy and HbA1C levels converge Intensive Intensive Intensive Intensive Conventional group Conventional group Conventional group Conventional Conventional Conventional 11 11 encouraged to switch encouraged to switch encouraged to switch to intensive to intensive to intensive 10 10 treatment treatment treatment (%) (%) 9 9 c c 1 1 8 8 HbA HbA 7 7 6 6 0 0 1 1 2 2 3 3 4 4 5 5 6 6 7 7 8 8 9 9 1 1 1 2 2 2 3 3 3 4 4 4 5 5 5 6 6 6 7 7 7 DCCT DCCT end end DCCT DCCT EDIC EDIC EDIC Year Year DCCT/EDIC: NEJM, 2005;353, No 25: 2643-2653
DCCT / EDIC – incidence of all predefined cardiovascular outcome • Patients previously receiving intensive treatment in the DCCT study had a 57% reduced incidence of nonfatal myocardial infarction, stroke or death from cardiovascular disease DCCT/EDIC: NEJM, 2005;353, No 25: 2643-2653
UKPDS resultspresented UKPDS: Post-Trial Changes in HbA1c Mean (95%CI) UKPDS 80. N Eng J Med 2008; 359
After median 8.5 years post-trial follow-up Aggregate Endpoint19972007 Any diabetes related endpoint RRR:12%9% P:0.0290.040 Microvascular disease RRR:25%24% P:0.00990.001 Myocardial infarction RRR: 16% 15% P:0.0520.014 All-cause mortality RRR: 6% 13% P:0.440.007 RRR = Relative Risk Reduction, P = Log Rank UKPDS: Legacy Effect of Earlier Glucose Control N Eng J Med 2008
Can long-term glycemic control reduce the risk of cardiovascular disease? Yes If early and sustained glycemic control started before atherosclerosis is established
At present, The question is not whether to intensively treat people with type 2 diabetes at onset of the disease to prevent long-term complications. The question rather is how to intensively treat patients with type 2 diabetes to consistently keep A1c < 7% all through the course of the disease
Glycemic control & A1c Target ADA: American Diabetes Association AACE: American Association of Clinical Endocrinologists
Two-thirds of Type 2 Patients are not Achieving Glycemic Control NHANES1 A1c <7% 44.5% 35.8% 1988-1994N=1215 1999-2000N=372 AACE survey 2003-20042 33% A1c 6.5% N=157,000 type 2 patients39 US states included NHANES = National Health and Nutrition Examination Survey. 1Koro et al. Diabetes Care. 2004;27:17-20; 2 “State of Diabetes in America,” American Association of Clinical Endocrinologists, 2003-2004. Available at: http://www.aace.com/public/awareness/stateofdiabetes/ DiabetesAmericaReport.pdf. Accessed January 6, 2006.
Traditional Type 2 Diabetes Management: A “Treat-to-Fail Approach” Published Conceptual Approach Mean HbA1cof patients OAD + multiple daily insulininjections Diet andexercise OAD monotherapy OAD up-titration OAD combination OAD + basal insulin 10 9 8 HbA1c Goal 7 6 Duration of Diabetes Conventional stepwise treatment approach OAD=oral antihyperglycemic agent. Adapted from Campbell IW. Need for intensive, early glycaemic control in patients with type 2 diabetes. Br J Cardiol. 2000;7(10):625–631. Del Prato S et al. Int J Clin Pract. 2005;59:1345–1355.
Delays often occur between stepping up from monotherapy to combination therapy Length of time between first monotherapy HbA1c > 8.0% and switch/addition in therapy (months) 25 20.5 months 20 14.5 months 15 Months 10 5 0 Metformin only Sulfonylurea only n = 513 n = 3394 Brown, JB et al. Diabetes Care 2004; 27:1535–1540.
66.6% 18.6% Clinical Inertia: Failure to Advance Therapy When Required Percentage of subjects advancing when A1C >7% < 8% At insulin initiation, the average patient had: 100 • 5 years with A1C > 8% • 10 years with A1C > 7% 80 60 44.6% % of Subjects 35.3% 40 20 0 Diet Sulfonylurea Metformin Combination Brown JB et al. Diabetes Care 2004;27:1535-1540.
Lifestyle Intervention + Metformin HbA1c ≥7% No Yes Diagnosis Add Sulfonylurea Add Glitazone Add DPP-4 inhibitor Add Basal Insulin ADA-EASD-Consensus 2006
Sulphonylureas failed to maintain glycemic control Glyburide 1 Glimpiride Glyburide Glibenclamide 0 Gliclazide Glyburide Hanefeld (n=250) HBA1c % Reduction -1 Tan (n=297) Chicago (n=230) Periscope (n=181) -2 ADOPT (n=1441) UKPDS (n=1573) 3 4 5 10 0 1 2 Time (years)
UKPDS: Islet -cell function and the progressive nature of diabetes Time of diagnosis 100 80 60 Islet -cell function (% of normal by HOMA) Pancreatic function = 50% of normal 40 20 0 10 9 8 7 6 5 4 3 2 1 0 1 2 3 4 5 6 Years HOMA = homeostasis model assessment Holman RR. Diab Res Clin Pract. 1998;40(suppl):S21-S25; UKPDS. Diabetes. 1995;44:1249-1258
Advantages of insulin • It lowers mean blood glucose in a predictable dose-dependent manner • Can be tailored to individual needs on a unit-to-unit basis • It has the longest experience than any other drug (90 years) • No contraindications to its use
Advantages of insulin • Insulin is the only drug that directly reduces lipolysis and free fatty acid concentrations in blood, thus reducing lipotoxicity • Insulin improves lipoprotein metabolism, decreases LDL cholesterol and triglycerides, and increases HDL cholesterol • Insulin improves endothelial dysfunction
thoughts/concerns about starting insulin • Common Fears: • Needles • Hypoglycemia • Weight gain • Common Beliefs: • Insulin is the last option • Insulin causes complications • Insulin is a personal failure • Adverse impact on relationships/lifestyle
What should I tell people with Type 2 diabetes about insulin? ‘Most people with Type 2 diabetes eventually need insulin because their own production of insulin falls off with time and they therefore inevitably become insulin deficient’
What should I tell peoplewith Type 2 diabetes about insulin? ‘If you need insulin, it doesn’t mean you failed. Tablets cannot control blood glucose forever, because they don’t stop the problem of your own declining insulin production getting worse’ • Islet -cell dysfunction worsens over time, regardless of therapy
What should I tell the person with Type 2 diabetes who needsinsulin, but doesn’t want to take it? ‘Insulin will not make your diabetes worse. In fact, it will help control your glucose, so you’ll have fewer complications and you’ll feel better.’ • Strict glycaemic control reduces the risks of both microvascular and macrovascular complications
Insulin Regimens • 1. Basal insulin ( NPH or long-acting insulin analogue) + OAD • 2. Total insulin replacement therapy - Premixed insulins - Basal-bolus
Diabetes 24-hour Plasma Glucose Curve:Rationale for Adding Basal Insulin 400 300 Glucose (mg/dL) 200 Normal 100 0 0600 1000 1400 1800 2200 0200 0600 Time of Day Adapted from Polonsky KS et al. N Engl J Med. 1988;318:1231-1239.
Diabetic 24-hour Plasma Glucose Curve:Rationale for Adding Basal Insulin 400 300 200 Glucose (mg/dL) 100 Normal 0 0600 1000 1400 1800 2200 0200 0600 Time of Day Adapted from Polonsky KS et al. N Engl J Med. 1988;318:1231-1239.
Starting With Basal Insulin in DM 2 – Advantages • 1 injection with no mixing • Insulin pens for increased acceptance • Slow, safe, simple titration • Low dosage • Effective improvement in glycemic control • Limited weight gain
Insulin Glargine vs. NPH Insulin Added to Oral Therapy Mean A1C Levels During Study 9 Insulin glargine NPH insulin 8 Mean A1C (%) 7 Target A1C (%) 6 0 4 8 12 16 20 24 Time (weeks) Riddle MC et al. Diabetes Care. 2003;26:3080-3086.
Less Hypoglycemia with Insulin Glargine vs NPH NPH Insulin glargine 3500 3000 2500 2000 1500 1000 Hypoglycemia events per 100 patient-years T1DM p=0.004 between treatments 6 7 8 9 10 HbA1c 200 150 100 50 0 Hypoglycemia events per 100 patient-years T2DM p=0.021 between treatments 6 7 8 9 10 HbA1c Mullins P et al. Clin Ther 2007;29:1607−19.
Glargine NPH insulin Insulin Glargine vs. NPH InsulinAdded to Oral Therapy Symptomatic Hypoglycemia by Time of Day Basal insulin 1.4 * * 1.2 * * 1.0 * * * 0.8 Events per Patient-Year 0.6 0.4 0.2 0 20 22 24 2 4 6 8 10 12 14 16 18 Time of Day (hour) Hypoglycemia defined as PG 72 mg/dL, by hour *P < 0.05 vs. glargine. Riddle MC et al. Diabetes Care. 2003;26:3080-3086.
Baseline Study endpoint Insulin Glargine Trials Showing Effective Reduction in HbA1c 10 9 8 7 6 5 9.5 8.85 8.80 8.80 8.71 8.61 HbA1c (%) 7.15 7.14 7.14 6.96 6.96 6.80 Treat-To-Target LANMET APOLLO LAPTOP Triple Therapy INITIATE
Insulin Glargine Plus OADs vsTwice-daily Premixed 70/30 Human Insulin Treatment Regimen Target: FPG 100 mg/dL Subjects (n=364) were randomly assigned to: • Insulin glargine once daily + continued OADs OADs* Premixed human insulin 70/30 BID Time (wk) 0 24 Baseline End Point *Sulfonylurea + metformin OAD=oral antidiabetic drug Janka HU, et al. Diabetes Care. 2005;28:254-259.
Insulin Glargine Plus OADs vsTwice-daily Premixed Human Insulin Change in A1C from Baseline to Study End Point* P=0.0003 Baseline 24 week A1C *Intent-to-treat analysis OAD=oral antidiabetic drug Janka HU, et al. Diabetes Care. 2005;28:254-259.
LAPTOP: Insulin Glargine Versus 70/30 Premixed Insulin in OHA Failures N=371 insulin-naïve patientsInsulin glargine + OADs vs twice-daily human NPH insulin (70/30)Follow-up: 24 weeks Twice-daily premixed insulin Insulin glargine + OADs p=0.0003 9 5 5.7 1.3% 1.7% 4 8 p=0.0009 3 Hypoglycaemia* (events/patient year) 7.5% HbA1c (%) 7 7.2% 2.6 2 6 1 5 0 *Confirmed symptomatic hypoglycaemia (blood glucose <60 mg/dl [<3.3 mmol/l]) Janka H et al. Diabetes Care 2005;28:254−259.
Conclusions • Due to declining -cell function, insulin therapy will be necessary for most patients with Type 2 diabetes • Insulin therapy should be initiated early when glycemic control exceeds the recommended targets • Insulin effectively lowers HbA1c, thereby reducing the risks of both micro- and macrovascular complications
Conclusions-cont. Insulin glargine when used as a basal insulin has the following advantages: • It effectively lowers fasting and mean blood glucose • Easily initiated and titrated • Low risk of hypoglycemia
Insulin glargine offers long-term efficacy without the need for intensification Insulin glargine provides superior long term efficacy vs. NPH. Gordon J, et al. Int J Clin Pract. 2010;64(12):1609-18. 52