Download
1 / 47
470 likes | 649 Views
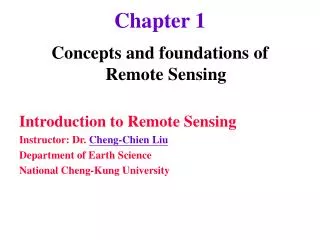
Geography 403 Guest Lecture: Urban Remote Sensing Rama Prasada Mohapatra PhD Candidate Department of Geography Spring 2010. Outline. Traditional Remote Sensing Applications Urban Remote Sensing: New Challenges Urban Land Use Classification The Vegetation-Impervious Surface-Soil Model

E N D
Geography 403 Guest Lecture: Urban Remote Sensing Rama Prasada Mohapatra PhD Candidate Department of Geography Spring 2010
Outline • Traditional Remote Sensing Applications • Urban Remote Sensing: New Challenges • Urban Land Use Classification • The Vegetation-Impervious Surface-Soil Model • Population Estimation • 6. Urban Growth Monitoring • 7. Urban Growth Modeling
Traditional Remote Sensing Applications • Vegetation (bio-geography) • Vegetation index • Biomass estimation • Leaf area index (LAI) estimation • Yield prediction • Geology • Oil inventory • Soil science • Climate studies • Etc.
Field spectrometry Truck-mounted imaging radar • Traditional Remote Sensing Applications Vegetation (bio-geography)
Traditional Remote Sensing Applications Wildfires (ASTER data) San Bernardino Mountains, California, October 28, 2003
Traditional Remote Sensing Applications Wildfires (MODIS) Los Angeles, California, October 27, 2003.
Band 2 Band 5 Band 7 Band 4 Band 3 Band 1 Landsat 5 TM Landsat 7 ETM+ EO-1 ALI EO-1 Hyperion Bare soil Senescent vegetation Green Vegetation 2. Urban Remote Sensing: New Challenges - Spectral issues
2. Urban Remote Sensing: New Challenges - Scale issues The study of the Earth requires many different levels of detail. Global forecast simulations use resolutions in the 40 to 200 kilometer range. 40 km
2. Urban Remote Sensing: New Challenges - Scale issues 10 kilometer resolution is characteristic of some atmospheric measurements from geosynchronous orbit. 10 km
2. Urban Remote Sensing: New Challenges - Scale issues 1 kilometer resolution is characteristic of weather satellite Earth images from geosynchronous orbit. 1 km
2. Urban Remote Sensing: New Challenges - Scale issues 30 meters is the resolution of a Landsat image. 30 m
2. Scale Issues - Scale issues 10 m
2. Urban Remote Sensing: New Challenges - Scale issues 4 m
2. Urban Remote Sensing: New Challenges - Scale issues 2 m
2. Urban Remote Sensing: New Challenges - Scale issues Some recent low Earth orbit commercial and Earth resource satellites have resolutions approaching 1 meter. 1 m
2. Urban Remote Sensing: New Challenges - Scale issues one-meter resolution (sharpened 4 meter) satellite image 11:46 a.m. EDT Sept. 12, 2001
2. Urban Remote Sensing: New Challenges - Urban issues • Urban landscapes are composed of a diverse assemblage of materials (concrete, asphalt, metal, plastic, glass, water, etc.) • The goal of urban construction is to improve quality of life. • Urbanization is taking place at a dramatic rate, with or without planned development • Sustainable development (congestion, pollution, urban heat island, commuting time issue)
2. Urban Remote Sensing: New Challenges - Remote sensing • Urban is a heterogenous region, with different kinds of manmade materials (impervious surface), such as asphalt, concrete, glass, etc. • Urban objects are small comparing to natural objects (e.g. forests, agriculture, geological structure, etc.) • Remote sensing data are typically in a medium resolution (e.g. Landsat Thematic Mapper 30 meter)
3. Urban Land Use Classification • American Planning Association “Land-Based Classification standard” for urban/suburban land use. • U.S. Geological Survey “Land-Use/Land-Cover Classification System” was originally designed to be resource-oriented. • Developed by Anderson (1976) in U.S.G.S. • Driven primarily by the interpretation of remote sensing data • Most land use classifications are based on this system (e.g. LULC data in 1990)
3. Urban Land Use Classification Anderson Level II 1: Urban 11: Residential 12: Commercial and services 13: Industrial 14: Transportation, communications, and utilities 15: Industrial and commercial complexes 16: Mixed urban and built-up land 17: Other urban and built-up land 2: Agriculture 3: Rangeland 4: Forest land …
3. Urban Land Use Classification • Can be downloaded from United State Geological Survey (USGS) website (http://landcover.usgs.gov/ftpdownload.asp). • Created from a satellite data, Thematic Mapper (TM), with 30 meter spatial resolution • Year 1992 - classification based on Anderson Level II (9 major classes with subclasses) • Year 2001- In addition to classification, impervious surface information and tree canopy coverage are available (not public available yet)
3. Urban Land Use Classification Land use (1992) Commercial High residential Low residential
3. Urban Land Use Classification - Problems and current research Problems: The average urban land use classification accuracy is about 80-85% (not adequate for urban growth monitoring and modeling) Research: 1) Spectral analysis (Sub-pixel classification) 2) Spatial analysis (texture analysis, wavelet analysis, etc.) 3) Con-textural analysis ( with localized knowledge) 4) Knowledge based analysis (Neural network, fuzzy classification, decision tree analysis)
4. The Vegetation-Impervious Surface-Soil Model • Assumptions • A remote sensing pixel includes more than one land cover types • Three basic compositions (vegetation, impervious surface, and soil) can represent the heterogeneous urban landscape. • The fractions of each composition can be calculated using mathematical techniques.
4. The Vegetation-Impervious Surface-Soil Model Impervious surface • Important indicator of urbanization • - a major component of urban infrastructure • - an indicator of human activities • Essential environmental index • - model run-off volume • - monitor water quality
5. The Vegetation-Impervious Surface-Soil Model -ANN Classification • Artificial Neural Network (ANN? • Relatively crude electronic models based on the neural structure of the brain • Most widely used multi layer perceptron • Three layer perceptron with back propagation algorithm provide better alternatives than statistical • “Neuralnet back propagation classifier” tool in IDRISI are capable of creating activation level maps
4. The Vegetation-Impervious Surface-Soil Model • Input layer nodes: the number of input bands is four for the base model • Output layer nodes: number of desired classes (3)
5. Population Estimation - House Count • Count the number of houses • Survey the average persons per house • Population = #house * #person/house
5. Population Estimation - House Count • The imagery must have sufficient spatial resolution to allow identification of individual structures • Some estimation of the average number of persons per dwelling unit must be available • Some estimation of the number of homeless, seasonal, and migratory workers required • It is assumed all dwellings are occupied
6. Population Estimation - House Count Advantages: Accurate Disadvantages: Manual counts, labor intensive and time consuming Cannot be applied in large urban areas
5. Population Estimation - Regression models • Regression with residential land use areas • Census data available • Residential land use classification • 2. Regression with spectral reflectance and its transformations • Census data available
5. Population Estimation - Regression models 3. Regression with impervious surface in residential areas IL: impervious surface in low density residential areas IH: impervious surface in high density residential areas
5. Population Estimation Population Estimation: Landscan Project • Input factors • Road • Slope • Land cover • Population places • Nighttime Lights • Urban density • Coastlines
5. Population Estimation Defense Meteorological Satellite Program
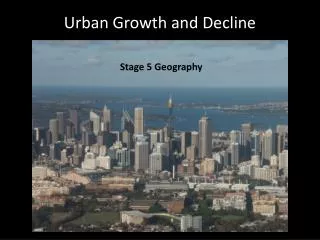
6. Urban Growth Monitoring • City of Roses: Guadalajara, Mexico
6. Urban Growth Monitoring - Methods • Classify remote sensing images of two dates, and compare the results • Image regression • Image differentiation • Normalized Vegetation Differential Index (NDVI) comparison • Impervious surface fraction comparison
6. Urban Growth Monitoring - Problems Image classification accuracy is not adequate for urban Growth monitoring study Seasonality changes of urban spectra
7. Urban Growth Modeling 1980 – 2025 From http://mcmcweb.er.usgs.gov/phil/modeling.html
7. Urban Growth Modeling • Ecometric model (Land-bid theory) Population Sub-urban Sub-urban CBD
7. Urban Growth Modeling 2. Land use allocation model • Locate a land which minimizes certain criteria • Transportation costs (commuting time) • Congestion • Pollution
7. Urban Growth Modeling 3. Cellular Automata (IDRISI software) • Bottom-up approach • Four components • 1) An action space • 2) a set of states • 3) the rules of neighborhood definition • 4) a set of state transition rules • 3. Simulate and calibrate using existing data
7. Urban Growth Modeling 4. Multi-agent models • Bottom-up approach • Multiple agents control urban growth process • 1) Urban planners • 2) Stakeholders • 3) Communities • 4) ……
7. Urban Growth Modeling • Problems: Model calibrations • Although many models have been developed, few of them have been calibrated and compared (not conclusive). • Many models fail to explain the undergoing forces of urban growth or sprawl.
END Geography 750: Urban Remote Sensing